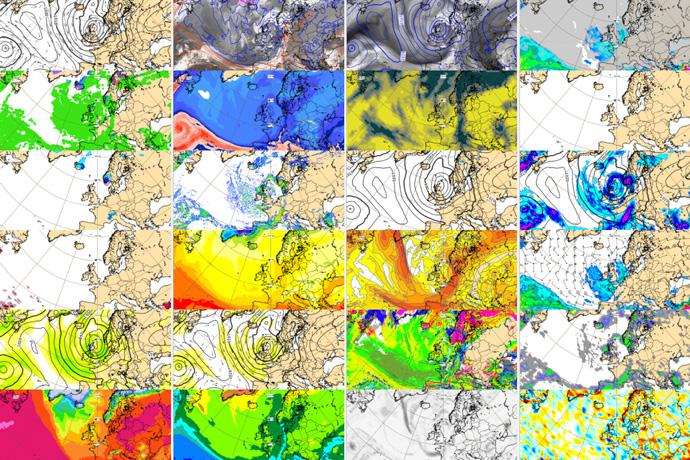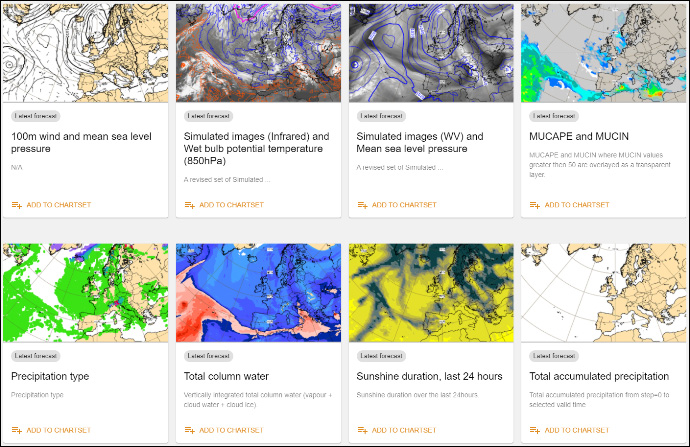

ECMWF’s OpenCharts Catalogue has been available online since October 2020; currently attracting around 25,000 users a week. Covering medium-, extended- and long-range forecasts, the products include parameters such as wind, temperature, precipitation and ocean waves. There is also a focus on ensemble-based products – such as probabilities, mean and spread – which indicate forecast confidence.

Just some of the over 250 OpenCharts available.
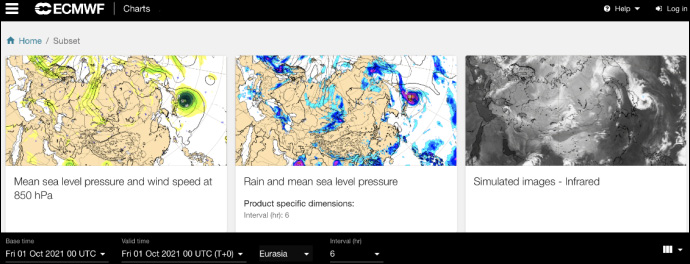
In a significant step forward for the catalogue, a new feature launched today, called ‘ChartSet’, gives the ability to create personalised subsets of the freely accessible charts. Users can select the parameters they would like to explore, set them to show the area of interest, and then compare them side-by-side to generate a tailored view of the forecast.

Screenshot of the ‘ChartSet’ tool, clearly showing a cyclone approaching the east coast of Japan. Three products are selected, with area set to ‘Eurasia’ and time interval set to six hours.
“We developed ‘ChartSet’ as an easy way for users to view different products simultaneously; a feature that is increasingly important as the number of available charts increases,” explains Senior Analyst Sylvie Lamy-Thepaut, part of the team that developed the tool. “Users can quickly check the different products and change time steps or areas in one click for the entire set of charts.”
New products available through OpenCharts catalogue
The new products added in October bring the total available to an impressive 264, and include some exciting parameters, such as lightning and visibility. All the new products, and most of the existing products, also now benefit from increased time steps – moving from 12–24 hours down to 3–6 hours; in line with ECMWF’s normal forecasting processes.
The free charts are based on the popular ecCharts licensed products, used by professional forecasters in ECMWF’s Member States, for example. OpenCharts aims to provide key information from the vast suite of tools available for ecCharts, delivering a pre-generated set of forecast charts that are of wide use to a broad audience. The new release aims to align the two catalogues; making the most representative products, which demonstrate the wide range of forecasting skill available within ECMWF, freely available to all.
One of the most interesting new forecast parameters available in OpenCharts is visibility. The product was one of several to be improved in the recent upgrade of ECMWF’s Integrated Forecasting System (IFS) to Cycle 47r3. The product now gives a more accurate representation of how the visibility will actually appear to observers. In response to user feedback, the upgraded product, shared through OpenCharts, represents the real-life situation much more accurately.
Ensemble-based products in OpenCharts have also been enhanced, providing more detailed information for users, such as probabilities for additional variables and weather types. For example, the high-resolution forecasts now show detail such as type of precipitation; as well as ‘rain’, it is now further classified into snowfall and freezing rain. These ensemble products supplement this with information on the likelihood of different precipitation types and what the alternative weather types are.
“We think that, as we head towards winter, users will be interested in parameters such as visibility, freezing rain and wind gusts,” explains the Head of Evaluation Section, David Richardson. “With the recent upgrades to the IFS, these are now more realistic and accurate, making them powerful tools.”
Future development of OpenCharts
The Web Services Team are still developing the OpenCharts catalogue; currently focusing on documentation. This is expected to be available by the end of the year and will include a forecast user guide and general information about products.
“Some charts do not have a detailed description, which may restrict their use by non-specialists. The new documentation will explain what is shown in individual charts and how to interpret them,” adds Sylvie.
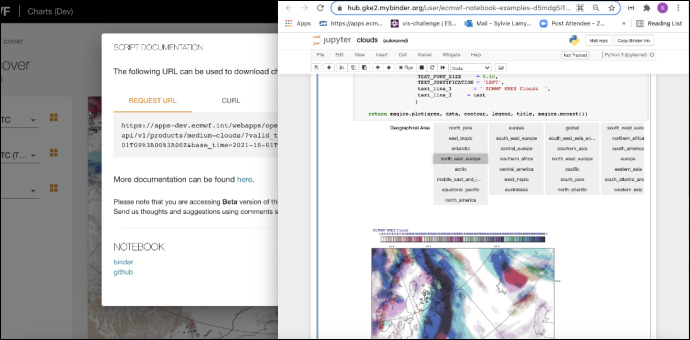
To complement information already available on ECMWF’s website, users will also be able to quickly access Jupyter Notebooks which will provide guidance on where to find and access data, and how to process and visualise it to reproduce the plots.

Screenshot of Jupyter Notebook-based documentation under development for OpenCharts.
As well as being part a wider aim to follow the ‘FAIR Principles’, which suggest that data should be Findable, Accessible, Interoperable and Reusable, it is hoped that the guidance will also free up the support team and so increase capacity for addressing more complex challenges.
Open products and the ten-year strategy
Part of ECMWF’s move towards open data, a key target within the 2021–2030 Strategy, the OpenCharts initiative has been warmly welcomed by users, ECMWF’s Member and Co-operating States, and the Technical Advisory Committee (TAC), which provides advice on the technical and operational aspects of the services.
