
A system to monitor and forecast wildfire danger in Europe is currently being developed in the framework of the EU-funded Copernicus Emergency Management Service. It aims to provide timely information to civil protection authorities in 39 nations across Europe by flagging up regions which might experience fire events due to high fire danger conditions. A novelty of the European Forest Fire Information System (EFFIS) is that it relies exclusively on weather forecasts to provide atmospheric forcings. This makes it possible to produce global fire danger forecasts with extended lead times. The traditional approach is for operational fire danger forecasting systems to be driven by local observations, mostly from weather observation stations.
ECMWF has developed EFFIS’s global fire danger modelling component, the Global ECMWF Fire Forecasting model (GEFF), over the last three years through a third-party agreement with the European Commission’s Joint Research Centre (JRC). GEFF is also the fire danger engine of the Global Wildfire Information System (GWIS), which is a GEO (Group on Earth Observations) initiative. GEFF uses the Centre’s medium-range and extended-range ensemble forecasts to drive three fire danger models originally developed in the 1970s by the US, Canadian and Australian forest services. Global EFFIS fire danger forecasts are available in a GWIS beta viewer on the JRC Forest website (Figure 1).
 beta viewer")
Tests show that fire danger indices calculated by GEFF from numerical weather prediction (NWP) outputs are in principle able to identify and predict high-danger conditions for fire events in large parts of the globe. The EFFIS products are therefore useful for both disaster management and planning preventive actions to confine fire-related damage. However, the system’s predictive capabilities are geographically uneven. Where vegetation fuel availability is large, such as in boreal forests, the Mediterranean, South America and Central Africa, fire events are mainly the result of drought conditions and predictability is high. On the other hand, in temperate regions where vegetation fuel availability is limited, such as the mountainous regions of Central Europe, outbreaks of fire can depend on highly variable conditions, such as the short-term superficial drying of the available organic matter on the ground. In these ecosystems the system’s predictive power tends to be lower.
Fire danger modelling
Fire danger is intended as a general term to express an assessment of both fixed and variable factors of the fire environment that determine the ease of ignition, rate of spread, difficulty of control, and fire impact. Fire danger therefore has several components and it is quantified using a combined metric expressing the probability of ignition, the speed and likelihood of spread and the availability of fuel. A model of fire danger is inherently probabilistic since it provides values related to the probability that a cause of ignition will result in a major outbreak. This means that extreme fire danger might or might not be followed by real fires, depending on whether or not there is a natural or human trigger. To establish whether fire danger conditions are in place, a fire danger model describes the effects that short-term and long-term variations in atmospheric temperature, humidity, precipitation and wind have on fuel moisture content and consequently on fire behaviour and occurrence. The US National Fire Danger Rating System (NFDRS), the Canadian forest service Fire Weather Index (FWI) and the Australian McArthur (MARK-5) model are all based on these concepts. They are routinely employed in those countries by forest management agencies to support fire control and suppression measures.
Traditionally fire danger evaluation has not benefited from modelling based on global weather predictions. Instead, danger conditions in forest centres are calculated using data from weather observation stations, where an evaluation of the vegetation state is also recorded. The resulting fire danger rating is then extrapolated to a large but undefined area surrounding the observation site. Thus, the real novelty of GEFF is that it implements a pure modelling approach based on ECMWF’s weather forecasts. Although locally this approach may result in a loss of accuracy due to the use of more approximate forcings, it has the advantage that it can provide global forecasts with an extended lead time.
GEFF
GEFF is a multi-model platform in which all three available rating systems are implemented (Figure 2). Each of the three fire rating systems incorporated into the GEFF model provides a comprehensive set of outputs which characterise different aspects of fire danger conditions. The indices put out by the three models in GEFF are not directly comparable. For the same kind of fire danger conditions, the GEFF values of the Fire Weather Index (FWI) from the Canadian model, the Fire Danger Index (FDI) from the Australian model and the Ignition Component (IC) from the US model can be very different.

The reason for this is that the different models apply different responses of the vegetation to weather forcings. For example, the FWI system is specifically calibrated to describe the fire behaviour in a standard jack pine stand (Pinus banksiana) typical of Canadian forests. The NFDRS model, on the other hand, implements a full description of vegetation through fuel type characterization and explicitly calculates the moisture content of dead and living vegetation. It divides dead fuel into classes according to their fast or slow response to changes in atmospheric temperature and humidity forcing, while living fuel is divided into herbaceous and woody and shrubs. Contrary to the other two models, the MARK-5 model includes no explicit description of the evolution of moisture in different fuel types. Instead, danger conditions are simply evaluated on the basis of a generic drought index representing fuel availability, called the Drought Factor (DF).
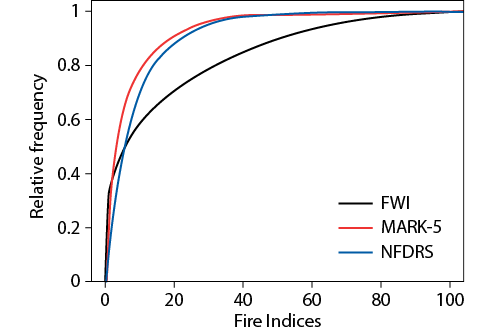
These differences make a direct comparison difficult and represent a barrier to integrating the different indices in an early warning application. The problem can be addressed by performing an index calibration based on historical index values: for any given location, any index value I is replaced by the relative frequency of historical occurrence of index values ≤ I. This relative frequency is measured by the cumulative distribution function, as illustrated in Figure 3. The normalised index thus takes values between zero and one. The calibration is usually performed in terms of quartiles and the information is summarised in danger classes, so that for example when the normalised index is above the second quartile, the danger is considered high.
In the following we limit the analysis of fire predictability in GEFF to the FWI, in the interest of providing a concise analysis of generic fire danger predictability. In the actual operational implementation of EFFIS, once high-risk areas have been identified, a more detailed analysis can be performed to characterise the event in terms of, for example, expected fire containment actions required. In operational practice this is usually achieved by also gathering information provided by all the other indices calculated in GEFF (Ignition component, Burning Index, and Fire Danger Index – see Figure 2).
Potential predictability
The skill of GEFF in predicting fire danger and behaviour ultimately depends on two factors:
- the accuracy of the modelling components which translate the status of the vegetation into fire danger
- the accuracy of the predictions of atmospheric conditions driving the model.
Model accuracy defines the upper boundary of the achievable skill of such a system. This is often called potential predictability and can be estimated by reducing errors in the forcings. This can, for example, be achieved by using atmospheric reanalysis. These datasets are created by combining a single, consistent model with quality-controlled observations of past conditions in an optimal way by means of a data assimilation scheme. A reanalysis provides a dynamically consistent estimate of the climate state at each time step and can be used as a good proxy for observed meteorological conditions. Being a model integration, it has the added benefit of providing a set of global fields, including variables which are not generally observed. How close reanalysis outputs are to actual meteorological conditions depends on the number and quality of observations available and on the accuracy of the model and of the assimilation scheme used. Even with these caveats in mind, fire danger indices calculated from reanalysis datasets are less affected by uncertainties in atmospheric forcings when compared to indices calculated from forecast fields. Therefore reanalysis fire indices can be compared to observed occurrences of fire to understand the potential predictability of fire danger provided by the modelling components, and to highlight the limitations of those components.
Fire index reanalysis has been performed using atmospheric forcings from ERA-Interim. The original data resolution of around 80 km was interpolated to a lat-lon regular grid of 0.25° to be comparable with the available observational dataset of fire events (Box A). Figure 2 shows which input data are needed to run GEFF and how the atmospheric forcings are linked to the various output components of each fire index system. The reanalysis dataset for fire danger was calculated starting from 1 January 1979 and running for 36 years with a daily time step, in accordance with the availability of ERA-Interim data. Since the initial conditions for vegetation are set using an idealised state, the fire variables suffer from the so-called ’spin up’ in the first few months of the forecasts as the model drifts to its equilibrium state. The first year of simulation was therefore discarded from further analysis. For this reanalysis run, all the fire indices were set to zero if snow was on the ground or the daily precipitation was above 1.5 mm/day. Areas where vegetation fuel is not available were masked out.
Regional variations
Observed fire
National inventories of wildfire events exist in many countries, but they do not provide the global coverage and/or the extended record needed for the validation of a fire danger system at a global scale. Satellite observations can supply a valid alternative, especially as they cover remote areas where in-situ observations are sparse. Satellite data have been used to monitor biomass burning at regional and global scales for more than two decades, using algorithms that detect radiative emissions from active fires at the time of satellite overpass, and in the last decade by using burnt-area algorithms that directly map the spatial extent of the area affected by fires.
The burnt-area dataset of the Global Fire Emissions Database (GFED4) combines several satellite products in a homogeneous time sequence of events from August 2000 to the present. It provides daily burnt-area fraction data with a 0.25° resolution. GFED4 combines 500 m MODIS satellite burnt-area maps with active fire data from the Tropical Rainfall Measuring Mission (TRMM) Visible and Infrared Scanner (VIRS) and the Along-Track Scanning Radiometer (ATSR) family of sensors. The daily burnt-area dataset is used in this article to validate the relationship between the modelled fire danger and the observed occurrence of fire episodes.
A regional analysis is necessary to understand in which countries/regions EFFIS and its model component GEFF provides sufficient potential predictability to be useful to plan fire control actions. The regional analysis is performed using the Extremal Dependence Index, a metric which is suitable for rare events (Box B). For any grid area a predicted fire is defined when the FWI value for that day is greater than the second quartile of its time series distribution available for the 35 years of reanalysis runs. An observed event is defined if at least 10% of the grid area (i.e. 2,500 hectares) has been burned as recorded by the GFED4 dataset (see Box A).
Figure 4 shows that potential predictability is very good in regions of the globe covered by boreal forests (taiga ecosystems). Since the boreal forest zone consists of a mixture of conifers (white and black spruce, jack pine, tamarack, and balsam fir), it is not surprising that the FWI performs very well, being specifically calibrated for this vegetation cover. Potential predictability is higher in the Canadian Boreal Shield West ecozone, where large fires occur frequently, than in Canada’s Montane Cordillera ecozone, where fires are numerous but tend to be smaller. The northern boreal parts of Eurasia and Siberia present a range of fire weather conditions very similar to those in boreal Canada. In these regions the vegetation is quite homogeneous and the values of the indices are controlled mostly by weather forcings. Despite the similarity in vegetation type, fire regimes can be very different, with fires in Siberia tending to be smaller than in Canada and relatively frequent, and to have moderate to high intensity. Unfortunately the observation dataset spans only 13 years, which means that areas such as the Nordic countries have too few events for a reliable assessment of potential predictability.
 for the Fire Weather Index (FWI)")
In Australia fires can develop in two very different environments. They can either burn in mountainous areas, which are usually densely forested, or they can start on plains or areas of small undulation predominantly made up of grassland or scrubland. In the first case fire episodes can be extremely intense and long-lived, while in the second case fires move quickly, fuelled by high winds in flat topography, and quickly consume the small amounts of fuel/vegetation available. Potential predictability using GEFF is reasonably good in either of these two regimes, but GEFF performs better in forested areas.
Wildfires in Southeast Asia, including in Thailand, Malaysia and Indonesia, tend to be human-caused. It is a common practice in Indonesia to start fires during the dry season (July to October) to clear land and remove agricultural residues. During intense dry seasons, these fires can penetrate into degraded sub-surface peat soil with enhanced flammability. Since such fires only tend to die down with the arrival of the heavy precipitation associated with the onset of the monsoon, fire seasons in these regions are controlled by rainfall seasonality associated with monsoon activities, which produce an annual or, in some regions, semi-annual wet–dry cycle. Although these ecosystems are very different from boreal forests, the FWI index performs reasonably well as an indicator of fire danger. This is not surprising since the occurrence of fires heavily depends on the prevalence of dry conditions, which are well represented in the reanalysis dataset used.
Assessing fire danger predictability
|
Event observed |
|||
|
Yes |
No |
||
|
Event |
Yes |
A |
B |
|
No |
C Misses |
D |
|
Assessments of potential fire danger predictability have to take into account that fire events are rare. Assessing the quality of predictions is therefore complicated by the fact that measures of forecast quality typically degenerate to trivial values as the rarity of the predicted event increases. This can be seen by considering a contingency table for observed and predicted fire events. Once the occurrence of an event has been defined for the forecast (for example if and only if FWI > 3rd quartile), it is possible to count the number of hits (A), misses (B), false alarms (C) and correct negatives (D) by comparing forecasts with observations. The resulting table can be used to derive skill measures. It can be shown that common skill scores tend to vanish as the base rate of observed events \(\frac{A+C}{A+B+C+D} \Rightarrow0\), regardless of actual forecast skill.
The Extremal Dependence Index (EDI) has been shown to be less dependent on the base rate and can be used to assess the potential predictability of fire danger. EDI provides a skill score in the range [-1, 1]. It is a function of how fast the hit rate converges to zero as the event becomes more rare, as opposed to being based on the base rate. EDI takes the value of 1 for perfect forecasts and 0 for random forecasts. It is greater than zero for forecasts that have hit rates that converge to zero more slowly than those of random forecasts and can be negative in the opposite situation. Therefore a system beats random forecasts if its EDI score is above zero, in which case it can be considered to have some skill.
In the Mediterranean, vegetation is dominated by a combination of shrubland and low forests. Persistent dry climatic conditions in summer favour the establishment of intense fire seasons in areas where fuel is available. Again, despite the very different type of vegetation compared to boreal forests, the FWI performs remarkably well in identifying fire danger in these ecosystems, especially in the southern parts of Spain, Greece and Italy.
The climate in central Europe is sub-continental temperate and the vegetation is characterised mostly by deciduous broad-leaved forests. The peak of fire activity tends to be just after snowmelt and before leaf production and is mostly driven by short-term dryness of surface soil layers rather than long-term drought. The potential predictability of fires is lower than in the Mediterranean.
Finally, the large forests of South America and Central Africa are characterised by large seasonal fires mostly initiated by agricultural burning. The peak of the fire season is in August and September and coincides with the end of the dry season. Given the vast availability of fuel in these regions, the good predictability of fire conditions can be attributed to the good representation of dry conditions in the reanalysis dataset.
What next?
We have shown that fire danger modelling based on weather forecasts can provide reasonable potential predictability over large parts of the global landmass. However, in order to cover the disaster management cycle, the mere provision of model output is not enough. It is necessary to link early warning systems, such as EFFIS/GEFF, to response actions. This will require a closer link between the developer of the modelling components and the disaster management services to develop products tailored to supporting all phases of fire management. The ultimate aim is a more effective response to emergencies and cost reductions for society.
Systems such as EFFIS/GEFF can help by providing an efficient and cost-effective way to understand the behaviour of wildfires and to be able to forecast their occurrence and spread. This makes it possible to take appropriate action to fight fires with the required resources in strategic points. Most probably, these strategic points are not even burning yet. Being able to assess the danger and the overall situation is essential to making the right short- and long-term tactical and strategic decisions. This is true of all stakeholders, from civil protection agencies and first responders to operators of critical infrastructure, insurance companies and affected citizens.
The ability to provide such assessments well into the future is where the strength of the EFFIS/GEFF system lies. The system could prove particularly useful if mechanisms were established at the national and European level (e.g. involving the EU Civil Protection Mechanism/Emergency Response Coordination Centre (ERCC)) so that modelling results can be translated into decisions.
Useful links
GEO programme for a Global Wildfire Information System (GWIS): https://www.earthobservations.org/activity.php?id=42
GWIS viewer:http://gwis.jrc.ec.europa.eu/static/gwis_current_situation/public/index.html
FURTHER READING
Di Giuseppe, F., F. Pappenberger, F. Wetterhall, B. Krzeminski, A. Camia, J. San-Miguel-Ayanz, G. Libertà, 2016: The potential predictability of fire danger provided by numerical weather prediction. J. Appl. Meteorol. and Climatol. (under review)