IFS upgrade brings more seamless coupled forecasts
Roberto Buizza, Gianpaolo Balsamo, Thomas Haiden
On 5 June 2018, ECMWF implemented a substantial upgrade of its Integrated Forecasting System (IFS). IFS Cycle 45r1 brings coupling to all ECMWF forecasts, from forecast day 1 to one year, by including the three-dimensional ocean and sea-ice model in the single high-resolution forecast (HRES). This is a further step towards the implementation of the 2016–2025 Strategy, whose goals include a more complete and seamless description of the Earth system across all ECMWF configurations.
Since 2013, a coupled model configuration with the community ocean model NEMO (the Nucleus for European Modelling of the Ocean, http://www.nemo-ocean.eu/) has been used in the medium-range/monthly ensemble (ENS) from day 0, and in 2016 coupling with the LIM2 Louvain-la-Neuve sea ice model developed at the Belgian Université de Louvain was introduced in ENS (Buizza et al., 2017b). The introduction of ocean and sea ice coupling in the HRES enables rapidly interacting processes (e.g. during tropical cyclones) to be better described. In line with increased ocean–atmosphere coupling, the sea-ice product used by the atmospheric analysis in IFS Cycle 45r1 is provided by ECMWF’s ocean analysis (OCEAN5). The upgrade introduces full ocean coupling in the tropics for both HRES and ENS, but it retains partial coupling in the extratropics. Partial coupling, as implemented in ENS in 2013, couples the sea-surface temperature tendencies rather than the actual sea-surface temperature field from the ocean model during the first four days of the forecast.
With IFS Cycle 45r1, an increased number of observations are assimilated, and the latest radiative transfer model (RTTOV-12) is used in the assimilation of all satellite radiance data. A better use of radiosondes, accounting for the drift during ascent, and improved aircraft bias correction lead to better analyses. Changes in the cloud microphysics and convection address longstanding systematic shortwave radiation biases (due to supercooled liquid water) in the storm tracks and over the southern oceans, as well as precipitation issues along coastlines. Modifications to the tangent-linear physics substantially improve the overall stability of the data assimilation.
In IFS Cycle 45r1, the model uncertainty scheme SPPT (Stochastically Perturbed Parametrization Tendencies) is revised, and the SKEB (Stochastic Kinetic Energy Backscatter) scheme is deactivated, bringing computing time savings of about 2.5%. The changes to SPPT make the Ensemble of Data Assimilations (EDA) more reliable and consistent with ENS. They have a positive impact on extended-range forecasts, e.g. in predicting the organised convection associated with the Madden-Julian Oscillation (MJO). Cost savings in the post-processing and changes to the software infrastructure enabled the introduction of the ocean model at essentially no extra cost. With IFS Cycle 45r1, for the first time lightning products will become available. See Lopez (2018) for details on the lightning parametrization and forecast performance.
The impact of the upgrade on forecast scores is positive over the tropics for both HRES and ENS. Over the extratropics, the impact is positive to neutral: overall slightly positive for HRES and mixed for ENS.
Summary of main changes
IFS Cycle 45r1 brings major changes in many areas of modelling, observation handling and data assimilation, and forecast infrastructure. These changes include:
Forecast model: Introduction of coupling of HRES to the 3-dimensional ocean model NEMO, with a 0.25 degree resolution and 75 layers, and LIM2 sea ice model (as in ENS, see the article by Keeley & Mogensen in this issue); improved numerics for warm-rain cloud microphysics and the vertical extrapolation for semi-Lagrangian trajectories; improved representation of supercooled liquid water in convective clouds (Forbes et al., 2016); improved representation of mid- to upper-stratospheric water vapour; new output parameters including maximum CAPE and CAPE-shear in the last 6 hours of the forecast and lightning flash density; new bathymetry (water depth) in the wave model, mainly affecting wave fields in coastal areas.
Data assimilation: For the first time, the atmospheric assimilation makes use of the OCEAN5 sea-ice analysis in the surface analysis of the high-resolution and EDA analyses. This enhances the coupling between the ocean and atmosphere. OCEAN5 makes use of LIM2 and assimilates the UK Met Office's OSTIA product instead of using it directly to define the sea ice initial conditions. Relative humidity increments are calculated using temperature instead of virtual temperature. The weak constraint model error forcing is applied at every time step instead of every hour to avoid shocks in the model integration. Changes to the tangent-linear (TL) and adjoint (AD) physics have led to a dramatic reduction in the number of spuriously large analysis increments in both the EDA and the high-resolution 4D-Var analysis.
Observations: Assimilation of non-surface-sensitive infrared (IR) channels over land; assimilation of all-sky microwave (MW) sounding channels over coasts; introduction of RTTOV-12 and new microwave instrument coefficients; retuning of the radiosonde observation error, and introduction of a scheme to account for radiosonde drift (Ingleby et al., 2018); assimilation of wave height data from JASON-3 and Sentinel-3A altimeters; use of BUFR SYNOP observations in the surface analysis, with more than 200 additional snow depth observations in China.
Model uncertainties (EDA, ENS):Improved flow-dependent error representation in the SPPT scheme via reduced spread in clear-sky regions (due to unperturbed radiative tendency in clear sky), the activation of tendency perturbations in the stratosphere, and weaker tapering of perturbations in the boundary layer; a reduction in the amplitude of the SPPT perturbation patterns (by 20%); introduction of the cycling of stochastic physics random fields in the EDA, and adoption of the same SPPT configuration in EDA as in ENS; deactivation of the stochastic backscatter (SKEB) scheme due to improved model error representation by the SPPT scheme (see above), leading to a 2.5% cost saving in ENS.
Software infrastructure: the ecBuild system is incorporated into the IFS source repository, which enables a standalone build of the IFS to be created on a workstation, with all required dependencies resolved automatically, and a small quality assurance test suite to be run. This will help to develop and test future code changes more efficiently.
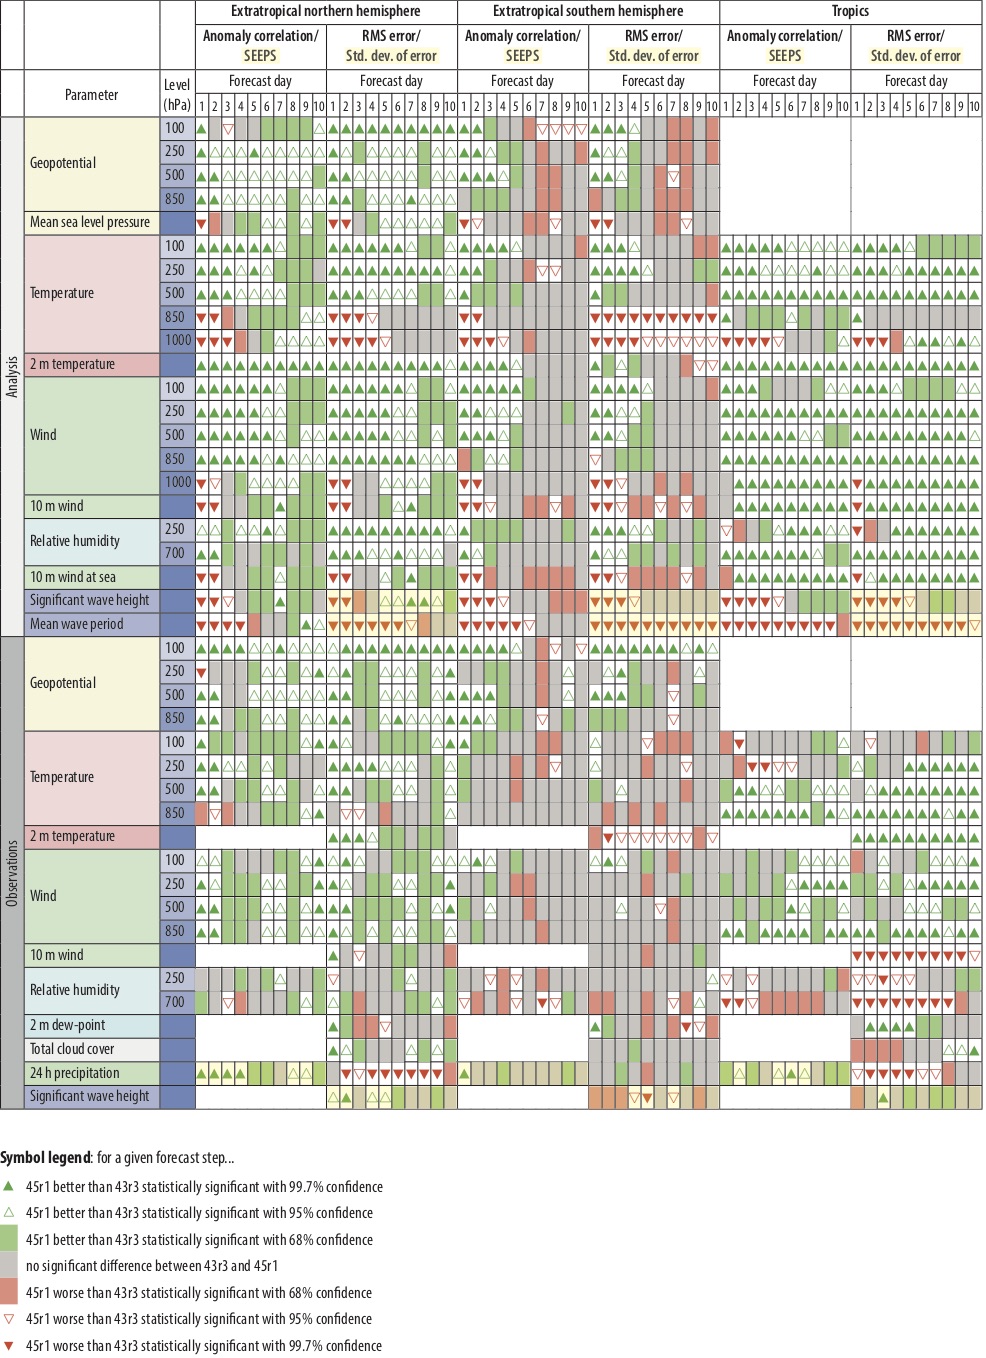
%3Cstrong%3E%20Figure%201%E2%80%82%3C/strong%3E%20HRES%20scorecard%20of%20IFS%20Cycle%2045r1%20versus%20IFS%20Cycle%2043r3,%20verified%20by%20the%20respective%20analyses%20and%20observations%20at%2000%20and%20%2012%20UTC,%20based%20on%20855%20forecast%20runs%20in%20the%20period%20December%202016%20to%20June%202018.%20See%20Box%20A%20for%20a%20discussion%20of%20how%20scores%20computed%20against%20analyses%20have%20been%20affected%20by%20changes%20to%20the%20analysis%20in%20IFS%20Cycle%2045r1. Figure 1 HRES scorecard of IFS Cycle 45r1 versus IFS Cycle 43r3, verified by the respective analyses and observations at 00 and 12 UTC, based on 855 forecast runs in the period December 2016 to June 2018. See Box A for a discussion of how scores computed against analyses have been affected by changes to the analysis in IFS Cycle 45r1.
Impacts
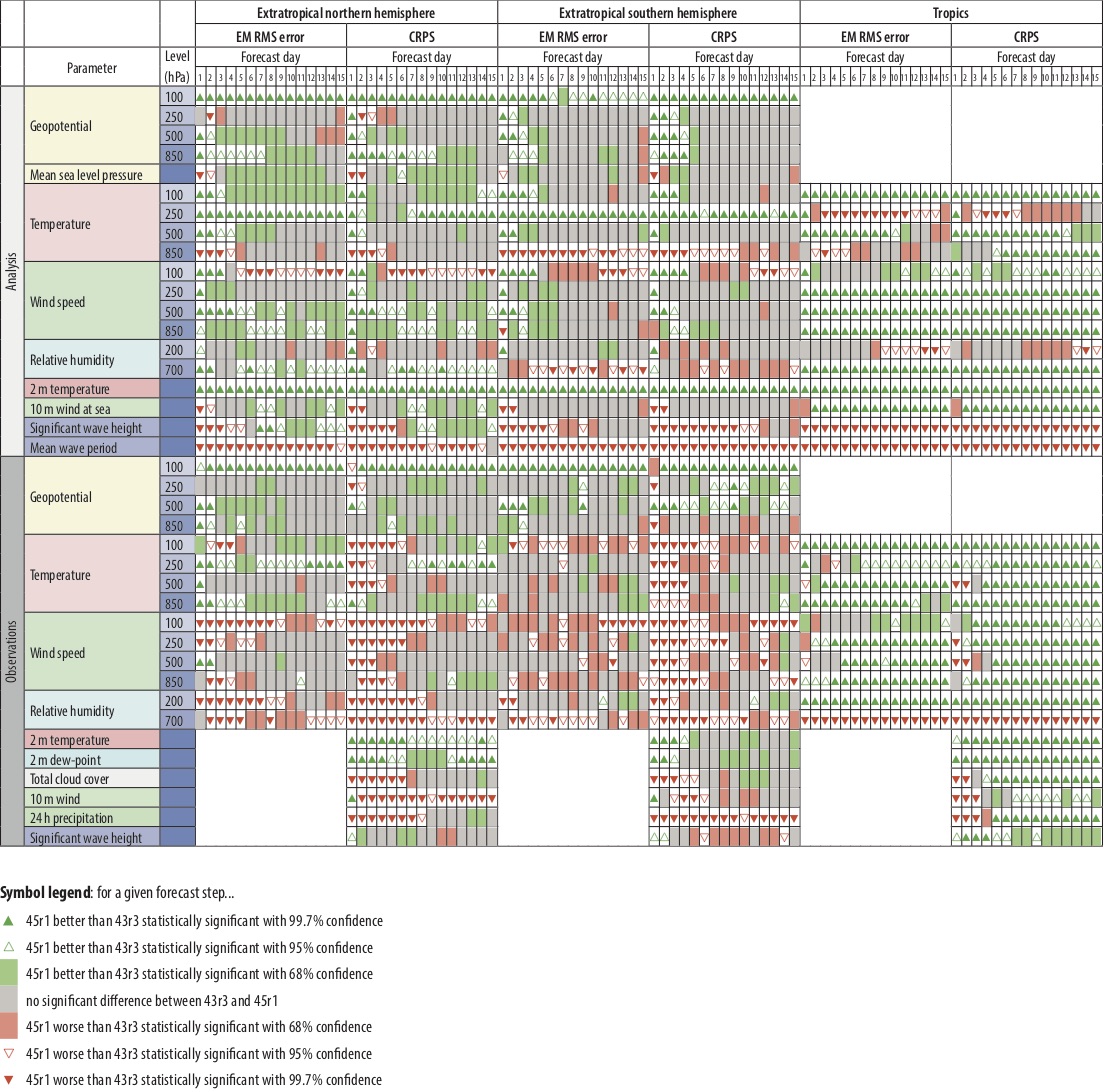
A comparison of parallel runs of the previous operational cycle (43r3) and the new cycle (45r1) indicates an overall positive impact in the tropics for both HRES and ENS (Figures 1 and 2). For the extratropics, results are mixed, with an overall slightly positive impact on the HRES scores, while for the ENS the sign of the impact depends on the geographical region and the variable.
%3Cstrong%3E%20Figure%202%E2%80%82%3C/strong%3E%20ENS%20scorecard%20of%20IFS%20Cycle%2045r1%20versus%20IFS%20Cycle%2043r3%20for%20medium-range/monthly%20forecasts%20up%20to%20forecast%20day%2015,%20verified%20by%20the%20respective%20analyses%20and%20observations%20at%2000%20and%2012%20UTC,%20based%20on%20408%20ENS%20forecast%20runs%20in%20the%20period%20December%202016%20to%20June%202018.%20See%20Box%20A%20for%20a%20discussion%20of%20how%20scores%20computed%20against%20analyses%20have%20been%20affected%20by%20changes%20to%20the%20analysis%20in%20IFS%20Cycle%2045r1. Figure 2 ENS scorecard of IFS Cycle 45r1 versus IFS Cycle 43r3 for medium-range/monthly forecasts up to forecast day 15, verified by the respective analyses and observations at 00 and 12 UTC, based on 408 ENS forecast runs in the period December 2016 to June 2018. See Box A for a discussion of how scores computed against analyses have been affected by changes to the analysis in IFS Cycle 45r1.
Upper-air fields
The new cycle leads to improvements in HRES upper-air fields. When these fields are verified against the model analysis, a positive signal is seen throughout the troposphere for most parameters, except temperature in the lower troposphere at shorter ranges. The latter is mainly a result of changes to the analysis, linked to changes in the stochastic scheme used in the EDA (see Box A). Forecast verification against observations shows a neutral impact. Upper-air improvements are more pronounced in the tropics, especially for wind and temperature. When verified against observations, upper-air changes are overall positive in the tropics except for relative humidity, and neutral to slightly positive in the extratropics. Upper-air results for ENS verified against the analysis are mostly positive in the tropics but more neutral in the extratropics. The negative signal for temperature in the lower troposphere at shorter lead times is again mainly due to changes in the analysis. Against observations, results are mostly negative in the extratropics at short lead times and significantly positive in the tropics, with the exception of relative humidity at 700 hPa. The negative impact in the extratropics is partly due to a slight reduction in ensemble spread associated with the transition to a physically more realistic SPPT scheme. Whether or not this reduced spread is genuinely detrimental depends on how significant the impact of observation errors is in the verification; this has not been routinely taken into account so far. Experimental verification against radiosonde data that takes observation error into account indicates that a large fraction of the negative ENS results disappear or become statistically insignificant.
Weather parameters and waves
There is an overall improvement in 2-metre temperature both in the HRES and ENS, particularly for Europe. The impact on 2-metre humidity is largely neutral for HRES and positive for ENS, particularly in the tropics, while for 10-metre wind speed the impact is largely neutral in the HRES but slightly negative in the ENS. Precipitation in the HRES is improved in terms of categorical verification (e.g. the SEEPS score), and near-coastal precipitation in warm-rain dominated situations is significantly improved due to changes in the cloud physics. However, the model changes lead to more activity at higher precipitation rates in active regions such as the East Asian monsoon, and as a result error measures such as RMSE or CRPS (for the ENS) are increased. The negative signal for significant wave height against analysis is a result of changes to the analysis resulting from a large increase in observation usage. Verification against observations (buoys) shows that results are neutral for both HRES and ENS.
A
Verification against analyses or observations?
During the testing and evaluation of IFS Cycle 45r1, a lot of effort was put into clarifying the relative role of verification against analyses and observations, and into upgrading the evaluation tools applied to assess the impact of the upgrade on forecast performance.
The analysis is the result of combining observations with a short-range forecast (the first guess). The weights given to the observations and the first guess depend on the observation errors and on the forecast error statistics. The former depend on the instrument, while the latter are flow-dependent and are based on the most recent EDA. Thus, changes to the EDA (e.g. an increase in its spread) induce a change in the relative weight given to the observations and the first guess. They thus cause the analysis to be closer to, or further away from, the observations.
In 45r1, changes to SPPT have induced an increase in the EDA spread in the boundary layer and a slightly reduced spread in the upper troposphere. The result is that overall the analysis is drawn closer to the observations, and further away from the first guess, especially in the lower troposphere. On average this improves the EDA reliability, but it can have a negative impact on the short-range forecast error evaluated against the analysis. Thus, care must be taken in interpreting the scorecard values computed against analyses (the top half of the scorecards) versus the values computed against observations (the lower part of the scorecards).
A second change introduced in 45r1 that has an effect on verification is the fact that more observations are used. This is the case, for example, for the ocean wave analysis. Since more observations are assimilated, again the analysis is drawn further away from the first guess, and this can have a negative impact on forecast scores computed against the analysis. The combination of the changes in EDA spread and the use of more observations explains why wave forecasts have an increased error when verified against analyses.
Vertical cross-section of the difference (in %) between the average EDA standard deviation of IFS Cycles 45r1 and 43r3 for temperature in January 2017. Positive values mean that the 45r1 EDA spread is bigger.
The coupling of the HRES from day zero and the full coupling in the tropics for HRES and ENS also have an impact on the verification against the analysis of near-surface fields. In the tropics, before the upgrade the high-resolution atmospheric analysis used the sea-surface temperature (SST) from OSTIA, while the coupled forecast model is initialised from the OCEAN5 SST.
Tropical cyclones
The implementation of the ocean–atmosphere coupling in the HRES removes the overall negative bias in tropical cyclone central pressure and thereby reduces the mean absolute intensity error by about 10% in the short range and by about 20% from day 5 onwards (Figure 3). Evaluations indicate statistically neutral results for the position error. For further details on the influence of ocean–atmosphere coupling on tropical cyclone intensity forecasts, seeMogensen et al. (2018).
Extended range
Changes in scores for the monthly system are generally positive across the range of parameters, with significant improvements for tropical winds. The only indication of degradation is for precipitation in the tropics with a consistent negative signal across all four weeks. There is an indication of a positive effect on skill across all parameters in Europe. Before the upgrade, there was too little spread in the MJO Index. Changes in 45r1 to the SPPT scheme have now brought the spread and error into close agreement throughout the 30-day forecast range. The underestimation of the MJO Index amplitude has been significantly reduced throughout the forecast.
Scorecard upgrades
To improve the evaluation of ENS, two major scorecard upgrades have been prepared. First, the 45r1 ENS scorecard now includes verification against observations for many more parameters, reflecting what has been done for many years for the HRES forecast. The plan is to use this upgraded ENS scorecard for all future cycle evaluations. The second upgrade is that, for some parameters, scores against observations have been computed taking into account observation errors. This allows us to measure the impact of a cycle change on ENS more correctly. It has for example emerged that, if observation errors are taken into account, then the statistical significance of certain changes can decrease. Work in this area has just started, and we will report more on the results once it is complete.
%3Cstrong%3E%20Figure%203%20%3C/strong%3E%E2%80%82Mean%20absolute%20error%20of%20HRES%20forecasts%20of%20tropical%20cyclone%20(TC)%20intensity%20(mean%20sea%20level%20pressure)%20in%20IFS%20Cycle%2045r1%20(using%20the%20coupled%20model)%20and%20in%20IFS%20Cycle%2043r3%20(using%20the%20uncoupled%20model).%20The%20sample%20comprises%20all%20TCs%20present%20at%20the%20initial%20time%20of%20the%20forecast;%20the%20sample%20size%20therefore%20decreases%20as%20the%20forecast%20time%20increases,%20consistent%20with%20the%20TC%20life%20span:%20it%20includes%20about%20750%20cases%20at%20initial%20time,%20decreasing%20to%20about%20200%20at%20forecast%20days%205%E2%80%936%20and%20to%20about%2050%20at%20day%2010.%20Bars%20indicate%2095%25%20confidence%20intervals. Figure 3 Mean absolute error of HRES forecasts of tropical cyclone (TC) intensity (mean sea level pressure) in IFS Cycle 45r1 (using the coupled model) and in IFS Cycle 43r3 (using the uncoupled model). The sample comprises all TCs present at the initial time of the forecast; the sample size therefore decreases as the forecast time increases, consistent with the TC life span: it includes about 750 cases at initial time, decreasing to about 200 at forecast days 5–6 and to about 50 at day 10. Bars indicate 95% confidence intervals.
Summary
The implementation of IFS Cycle 45r1 brings us another step closer to the implementation of ECMWF’s Strategy. It means that HRES, ENS and SEAS5 now use the same coupled ocean, sea-ice, land and atmosphere models, and it makes the simulation of model uncertainties identical in the EDA and ENS. It enables the use of more observations and improves their assimilation, and it includes changes to the model physics that bring an improved representation of Earth system processes. The upgrade also introduces new output parameters that can help to save lives by providing additional indications of severe weather. Overall, the changes included in IFS Cycle 45r1 have a neutral or slightly positive impact on forecast scores, with larger improvements over the tropics and for extended-range predictions. The upgrade also helps to pave the way for future progress by updating ECMWF’s software infrastructure.
FURTHER READING
Buizza, R., P. Bechtold, M. Bonavita, N. Bormann, A. Bozzo, T. Haiden, R. Hogan, E. Holm, G. Radnoti, D. Richardson, & M. Sleigh, 2017a: IFS Cycle 43r3 brings model and assimilation updates. ECMWF NewsletterNo. 152, 18–22.
Buizza, R., J.-R. Bidlot, M. Janousek, S. Keeley, K. Mogensen & D. Richardson, 2017b: New IFS cycle brings sea-ice coupling and higher ocean resolution, ECMWF NewsletterNo. 150, 14–17.
Forbes, R., A. Geer, K. Lonitz & M. Ahlgrimm, 2016: Reducing systematic error in cold-air outbreaks. ECMWF NewsletterNo. 146, 17–22.
Ingleby, B., L. Isaksen, T. Kral, T. Haiden & M. Dahoui, 2018: Improved use of atmospheric in situ data. ECMWF Newsletter No. 155, 20–25.