Having real-time access to sub-seasonal forecast data from ECMWF has been transformational for African meteorological agencies. It has enabled the co-production of new bespoke forecast products with users to support their decision-making in a variety of sectors. They range from health metrics – combining temperature, relative humidity and wind to support predictions of meningitis outbreaks across the Sahel – to precipitation forecasts supporting hydropower planning – leading to reduced use of diesel and uninterrupted energy production in Kenya. Providing these forecast tools, tailored to the decision-making context of users, has supported preparedness action in areas where peoples’ lives and livelihoods are particularly vulnerable to weatherrelated extremes.
Recent advances in the understanding of sources of sub-seasonal predictability (e.g. the Madden–Julian Oscillation), and their predictive skill across Africa, have the potential to improve preparedness action and early warning of high-impact weather. However, across much of sub-Saharan Africa forecast information on these timescales is either unavailable or existing tools are inappropriate for effective action-based forecasting.
Sub-seasonal forecasting testbed
The African SWIFT (Science for Weather Information and Forecasting Techniques; https://africanswift.org) project is running a two-year (2020–2021) forecasting testbed as part of the sub-seasonal to seasonal (S2S) Real-Time Pilot Initiative. The project was authorised by ECMWF’s Council in support of the World Meteorological Organization’s WWRP (World Weather Research Programme) and WCRP (World Climate Research Programme). The testbed combines knowledge from researchers, forecast producers and forecast users to co-produce and evaluate sub-seasonal forecast products tailored to the decision-making context of users in sectors such as agriculture, health, food security, energy and disaster risk reduction.
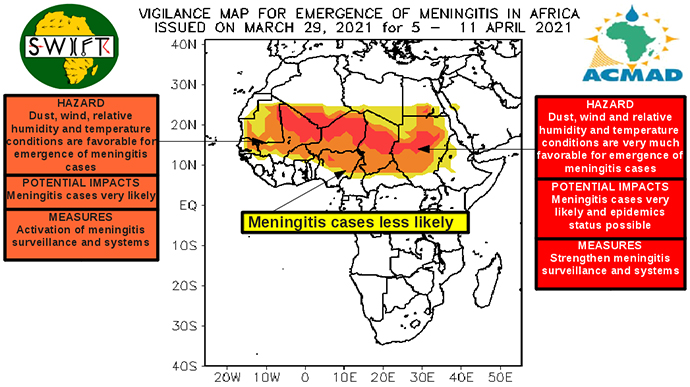
The testbed supports the provision of real-time sub-seasonal ECMWF data (1–4 weeks ahead) to African meteorological agencies in four SWIFT partner countries: Ghana, Kenya, Nigeria and Senegal, as well as two (regional and pan-African) climate centres. Weekly forecast initialisations are downloaded, and SWIFT partners access the data directly to co-produce forecast products with their users. At the outset, each of these six operational groups identified a key user who had weather-related decisions to make on sub-seasonal timescales. In Ghana and Nigeria, the focus has been the provision of precipitation information (e.g. weekly anomalies) to inform agricultural decisions. In Kenya key users are an energy company using precipitation forecasts for hydropower planning and a dairy farm utilising extreme temperature forecasts for production decisions. ICPAC, the regional climate centre in East Africa, has been using precipitation, temperature and soil moisture to inform food security decisions in the region. Access to the real-time data has enabled the African Centre of Meteorological Application for Development (ACMAD) to add forecast information, combining temperature, relative humidity and wind, to its existing meningitis outlooks and improve the early warning of potential outbreaks (see the figure).
Using this co-production approach shifts the emphasis away from a supply-driven forecast product to a demand-led process, which seeks to better understand and incorporate knowledge from users. Having direct access to the raw data during this forecasting testbed has enabled user-directed iterations to forecast products to make them more actionable. For example:
- Multi-variable metrics: using multiple forecast variables to create new combined metrics for specific applications. For example, temperature, relative humidity and wind forecasts are combined for application in the health sector to predict the prevalence of meningitis across the Sahel (see the figure).
- Data manipulation: directly manipulating the data to provide more user-relevant products. This includes applying different spatial and temporal averaging; the application of appropriate user-defined thresholds; and forecast calibration to enable the provision of user-relevant total values rather than anomalies. For example, the temporal averaging is changed to be consistent with existing forecasting tools (Central Africa).
- Product visualisation: co-developing how the forecast data is presented to ensure all the information is clear, correctly interpreted and relevant for its intended application. This includes tailoring colour scales to match existing products; showing smaller regions; changing the format; and combining forecast data with local monitoring data. An example is the combination of recent rainfall observations with model climatology and forecast data on one plot for improved user application (Kenya).
This sub-seasonal forecasting testbed has successfully piloted the provision of data directly to meteorological agencies and regional climate centres in Africa. Co‑producing bespoke forecast products in this way has the potential to increase their uptake and thereby more effectively translate advances in predictability into real benefits for societies and economies. However, it comes with challenges. Firstly, accessing and manipulating raw forecast data to provide tailored products requires capacity building within institutions. Secondly, tailoring forecast products for specific users is time-consuming and will require considerable resource investment to ensure the sustainability of project-initiated services. Thirdly, these forecast products are only useful if the information within them is reliable. Therefore, emphasis needs to be given to the ongoing evaluation of forecast products, both in terms of meteorological and user verification.
Outlook
This short pilot project has demonstrated huge potential for improving the use of sub-seasonal forecast data to support decision-making in Africa. However, its continued progress relies on national and regional met services having direct access to the real-time sub-seasonal forecast data to develop and provide bespoke forecast products.