In early September 2023, a set of extreme rainstorms led to devastating flooding in parts of Greece, Bulgaria and Türkiye. These events related to development of a surface cyclone nearby on the night of 4 September, assigned the name ‘Daniel’ as part of a EUMETNET cyclone naming initiative (Cusack et al, 2017). In subsequent days, Daniel meandered slowly across the Mediterranean before adopting an east-south-eastward trajectory near northern Libya late on 8 September, whereupon it became a medicane. Landfall was near Benghazi around 23 UTC on 9 September. Remarkably, the medicane deepened further over land. The resulting intense rainfall over the Akhḍar (Green) mountains of northern Libya on the night of 10–11 September drained into the small Wadi Derna catchment and went on to cause catastrophic flooding in the city of Derna. Two dams burst, and there were 5,000–15,000 fatalities as buildings were swept away. This was likely the deadliest rainfall-related flooding disaster since ECMWF started producing operational forecasts in the late 1970s and the second most deadly dam-related disaster of all time. This article examines some of the meteorology and hydrology at play, whilst providing insights into predictability aspects, forecast quality and event rarity. In so doing we synthesise many aspects of ongoing work at ECMWF, and beyond.
Supplementary forecast and observation charts for this episode can be found in two case links in ECMWF’s online severe event catalogue: https://confluence.ecmwf.int/display/FCST/Severe+Event+Catalogue.
Defining Daniel’s full history
Figures 1a,b depict the full eight-day lifecycle of Daniel – its track and central pressure. This is based on UK Met Office surface analyses, augmented, from 12 UTC on 9 September onwards, by reassessment of 15-minute interval satellite imagery sequences (from the EUMETView tool: https://view.eumetsat.int/productviewer) and other observations, alongside ECMWF high-resolution (HRES) analysis fields.
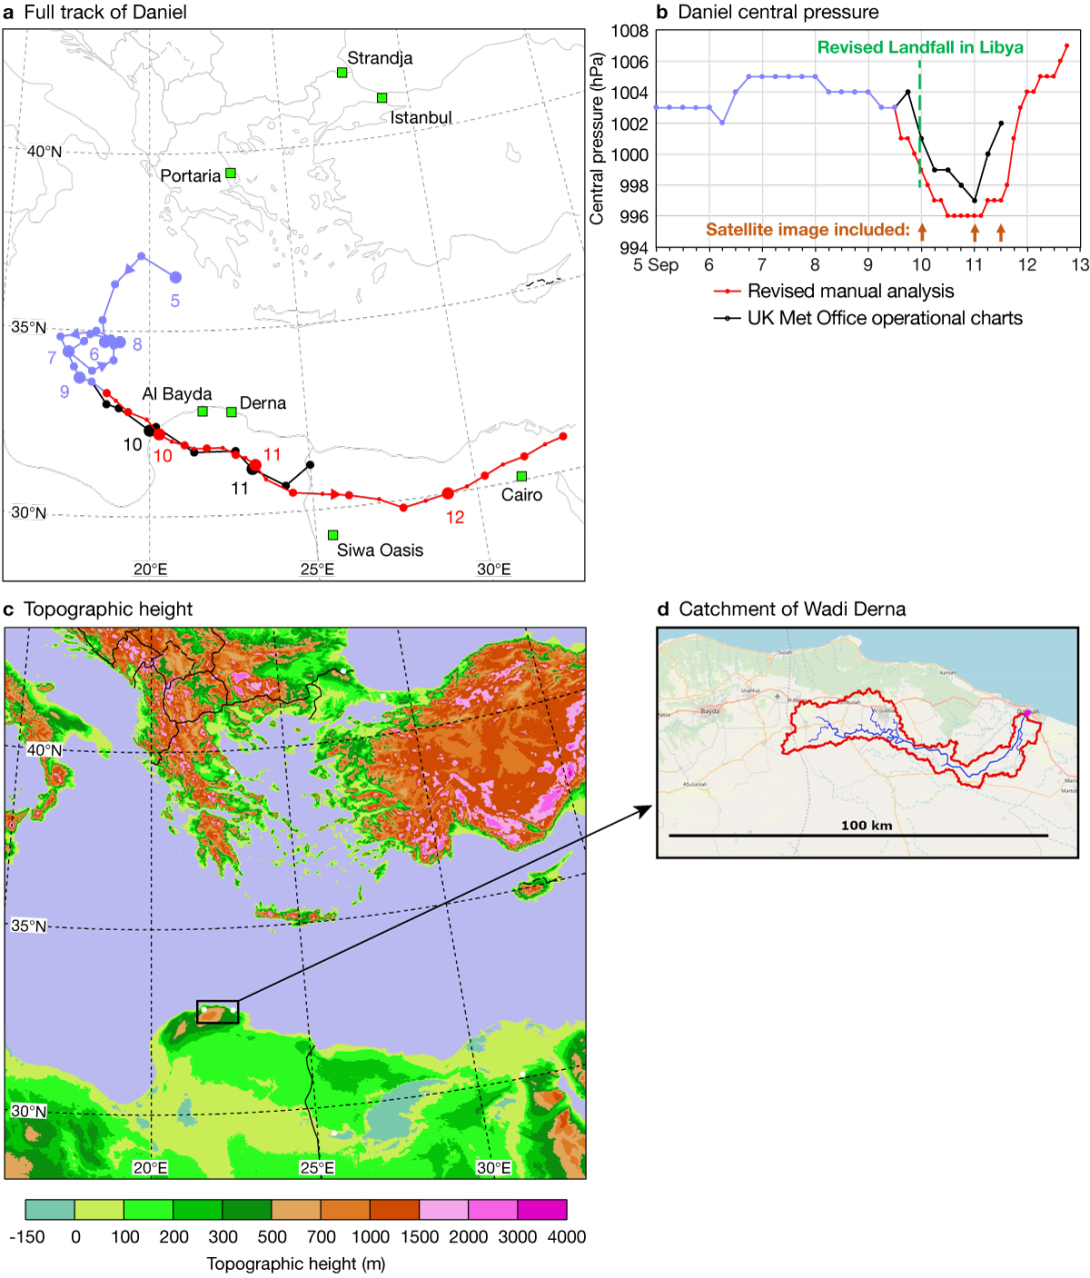
Reassessment led to a deeper, repositioned centre over northern Libya on 10 and 11 September, and track extension across Egypt (beyond the Met Office chart domain) on 11 and 12 September.
Evidence for the adjustments included hourly METAR observations of mean sea-level pressure and 10 m mean wind, from Siwa Oasis on 11 September and Cairo on 12 September (Figure 1a), that conflicted with model data. Siwa Oasis winds reached 34 kts at 11 and 12 UTC on 11 September as the low passed by. Meanwhile, visible imagery early on 11 September showed a substantial tower of elevated dust/sand in the cyclone centre (Figure 2c), which would have needed near-centre 10 m wind speed in excess of 20–25 kts to accrue, which even 9 km resolution model solutions did not show. Likewise, aerosol optical depths from a Copernicus Atmosphere Monitoring Service (CAMS) numerical model run (40 km resolution), used to pinpoint dust and sand, showed no sign of near-centre concentration (compare Figures 2c,d). This all pointed to a deeper low with a tighter core, which had probably existed for some time.

Further investigations showed Siwa Oasis METAR data were not available for assimilation at ECMWF; pressure would have been used otherwise. Over land, 10 m winds are not assimilated, although for flat terrain a case could potentially be made for their use, especially for sites in data-sparse areas such as this one.
ECMWF runs an ensemble of 50 data assimilations (EDA members), to try to represent analysis uncertainties. These can provide options for reassessment when the main analysis is in doubt. There were typically 5 hPa ranges in EDA central pressures for Daniel from 10 September 00 UTC onwards; our revisions were mostly within these ranges. Only at 12 UTC on 11 September did our revised pressure step outside: 997 hPa versus 998 hPa in the deepest EDA member, justified by the aforementioned METAR non-availability.
Why did Daniel develop?
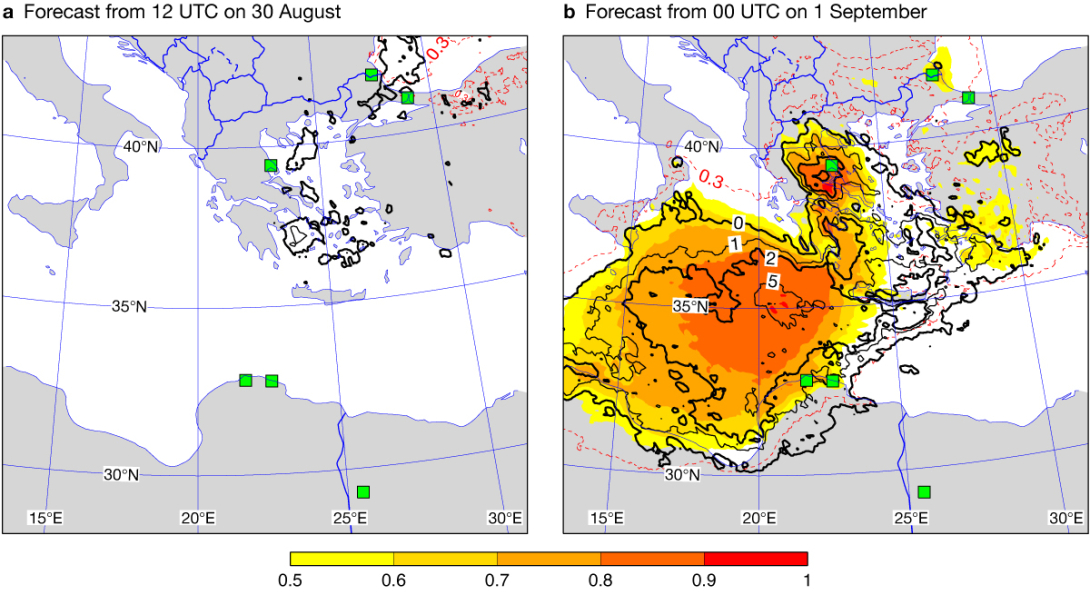
We now examine the broadscale synoptic drivers for Daniel. Conceptually, the synoptic-scale environment conducive to development and persistence of such a feature is a quasi-stationary upper-level trough or cut-off low. This was present over many days in early September 2023 (blue and green contours on Figure 3). This is unusually far south for September, and indeed requires, in turn, a quasi-stationary omega block or strong upstream ridge over central Europe for ‘maintenance’ (a later snapshot of this can be seen in Figure 10b – green contours). For rainfall associated with Storm Daniel over Greece and the Mediterranean on 4–8 September, the signal for an extreme event appeared in the ECMWF ensemble (ENS) between 30 August and 1 September. A dramatic change can be seen in the EFI (Extreme Forecast Index) and SOT (Shift Of Tails) for total precipitation comparing forecasts from the two dates, separated by 36 hours (Figure 4). The 30 August errors were on a large scale, and related to prediction of the upstream blocking over Europe. Tracking this error back in time, we found a connection to the interaction between hurricane Franklin and the mid-latitude wave guide, which took place around 1 September over the central Atlantic. Small phasing errors between Franklin and an upper trough quickly amplified around that time and led to significant errors downstream in the block and the cut-off low. Indeed, this extreme sensitivity was manifested in an extremely large difference emerging between the HRES forecast and the ENS control forecast, which currently have minute configuration differences (e.g. cm in topographic heights) for accidental technical reasons, but are otherwise identical. Once large uncertainties in the extratropical transition had gone, the large-scale predictions of the environment for Daniel improved and the signal for extreme rainfall increased.

What drove the local behaviour of Daniel?
Here we discuss Figure 3, which shows mean sea‑level pressure, and geopotential height in the mid- to upper troposphere, at four representative moments in Daniel’s lifecycle.
- On the night of 4–5 September, genesis occurred, apparently in response to upper-level left-exit forcing, ahead of jet cores (or stronger geostrophic gradients) which are themselves co-located at 500 and 300 hPa west of Daniel (Figure 3a). This is a typical juxtaposition for extratropical cyclone development.
- Several days followed with little variation in minimum pressure (Figure 1b). One can infer minor pulses of upper forcing, but mostly the atmosphere was in a barotropic or equivalent barotropic state, as demonstrated by concentric contours at all three levels in Figure 3b. In this scenario, the latent heat release from active bursts of convection around the low (seen on imagery), if symptomatic of strong enthalpy fluxes over the high autumn sea-surface temperatures (SSTs), will balance out the tendency for frictionally induced decay, and keep the low going. In other medicane cases, when organised convection encircles the low, one tends to see deepening as the low feeds off strong fluxes. However, for Daniel this organisation was lacking until 8 September. This was in spite of SSTs being ~1°C above normal, and in spite of ‘potential intensity’ here being high (computed to be 50–60 m/s following Bister & Emanuel, 2002; see Figure 5b for a related construction for a later time). The night of 8–9 September then brought some convective organisation and the onset of modest deepening (Figure 1b).
- On the night of 9–10 September, Daniel made landfall. Whilst the imagery signal had again become more muted (Figure 2a), and whilst the low and middle troposphere remained in a relatively barotropic state (Figure 3c), at 300 hPa a marked upper-level low was approaching from the west (marked ‘U’). In response to the associated vorticity/potential vorticity advection, and a saturated column beneath which promotes a large Rossby penetration depth, the surface low deepened further over land. This might seem somewhat strange when medicanes commonly decay over land, but in truth Daniel was a hybrid system at this stage, positioned somewhere within a broad ‘grey zone’ that spans surface-flux-driven development to baroclinically-driven development. Likewise, forcing from just very high levels is also rather atypical, and different to the situation in Figure 3a. During 10 September, cold-topped cloud became much more widespread (compare Figure 2b with 2a), commensurate with further deepening, and the intensity of the flooding rains probably peaked.
- Some time after 00 UTC on 11 September, when cyclonic features were almost vertically stacked again throughout the troposphere (Figure 3d), the surface low began to fill, as frictional decay took over in the absence of contrary dynamical and thermodynamical drivers.
The ‘unexpected’ deepening of tropical cyclones over land, which occasionally takes place over Australia (where such cyclones have been called Agukabams) and exceptionally over the US (section l in Emanuel, 2018), has been hypothesised to be due to uptake of heat from hot soil/sand, promoted by precursor rainfall wetting the sand and accordingly increasing its thermal conductivity. Such situations are finely balanced, with the right amount of rain needed ahead of the cyclone, on the right timescales. There was a distinct possibility that such a mechanism was active in the current case, alongside upper-level forcing. Within its soil component, ECMWF’s Integrated Forecasting System (IFS) includes a representation of thermal conductivity dependence on moisture content. We ran ENS experiments with this turned off to ascertain whether the Agukabam mechanism could have been at play. Although the soil seemed to be sufficiently hot (of order 30°C at the outset), there were no systematic differences between operations and the dry soil experiment in terms of either Daniel’s depth or the associated enthalpy fluxes. This means that either the mechanism was unimportant for this case, or that imperfections in the IFS soil physics, soil classifications or other factors meant that we could not elucidate an impact. The fact that Daniel appears to have been at the deeper end of the EDA range hints that an active process may have been under-represented or unrepresented, but we do not know what.
Rainfall and forecasts for southeast Europe
Whilst the extreme rainfall in Libya in September unequivocally relates to the passage of Daniel, flooding rains further north owed their existence more to uplift of an influx of intrinsically warm, moist air from marine sources to the northeast: the Black Sea in the case of Bulgaria and Türkiye, and the Aegean in the case of Greece (note the airflow implied by the red contours on Figures 3a,b).
Uplift can have perhaps three drivers: dynamical forcing (related in this case to advection of vorticity filaments around the nearby upper lows); surface triggering of unstable air (provided in this case by high sea-surface temperatures – a common autumn rainstorm-driver in the Mediterranean); and the projection of steady airflow onto topographic slopes. In the current case all appear to have been active, to varying degrees, and interactive.
Three sites where particularly high intensities/quantities of rainfall occurred, and where severe flooding impacts were reported in the media, are marked in Figures 1a,c and shown in Figure 6b (labels B, C, A): Strandja in Bulgaria, 330 mm on (just) 5 September; Istanbul in Türkiye, 125 mm on 5 September; Portaria in Greece, 762 mm on 5 September and 1,096 mm 5–8 September. Flooding over Greece was very widespread, due to rain over many days, and focussed on the Thessaly region in central Greece in particular. Here large lakes were created or re-created (Figure 6b: land had been reclaimed from Lake Karla in 1962 for cultivation purposes).
The HRES model sounding for Portaria in Figure 5a is believed to be indicative for the three locations (Strandja, Istanbul and Portaria). One can identify high moisture content (12 g/kg at low levels), a propensity for SST (26°C) triggering of ‘skinny’ Convective Available Potential Energy (CAPE) up to the tropopause, and strong onshore flow (~35 kts) that projects onto a mountain chain east of Portaria (Figure 1c, ridge height reaches 1,600 m). The topographic height/forcing is less at Strandja and Istanbul, but likely still relevant. Moreover, the persistence of the flow, allied to slow-moving Daniel (Figure 1a), was a key factor for Greece.
On the broadscale, we see from Figure 4 that there is a signal regarding extreme rainfall from 1 September onwards, which is 3–4 days in advance. The EFI/SOT signal strengthened at shorter leads (not shown here).

Within the EU-funded Destination Earth (DestinE) initiative of the European Commission, ECMWF has been running in experimental mode higher-resolution (4.4 km) global simulations (Vannière et al., 2024). We expect these to deliver more accurate rainfall forecasts for sites due to better representation of convection (albeit still parametrized to some extent) and topography, and reduced sub-grid variability, all because of the smaller grid-box size. Here we examine and illustrate that capability, by comparing concatenated short lead-time rainfall forecasts for 4–7 September (Figure 6) between these DestinE runs and the unperturbed operational HRES (9 km resolution). We use short leads to try to illustrate potential predictability, by disassociating from broader-scale errors that can contaminate the picture at longer leads (e.g. as demonstrated with Figure 4).
Figure 6 shows that the overall pattern, with the most extreme rainfall in central Greece (b), is well captured in HRES (a) and even better in DestinE (c). Indeed, DestinE does better near Portaria (see label A on Figure 6b) with higher peaks, and a tendency to shift the maximum inland, away from coastal waters. Note the strip of cyan over the sea in HRES – this is symptomatic of a known model deficiency, linked to convective parametrization and an inability to move convective cells. Near Strandja (B), there are hints of similar advantages in DestinE, but both realisations fall well short of the observation (80–100 mm versus 330 mm). Neither simulation provides any indication of extreme rainfall in Istanbul (C), which is disappointing. The operational ENS was also not very helpful here (Figure 4b) and this signal did not improve at shorter lead times. The cluster of high totals near Athens (D: 50–150 mm) is also not well represented (~20–40 mm forecast). Finally, note that there are hints of the aforementioned coastal waters issue in the DestinE runs near the three ‘fingers’ of the Chalkidiki peninsula (E). In summary, DestinE performed a bit better than HRES, but the need to still parametrize convection to a certain extent still creates issues.

Rainfall and forecasts for Libya
In contrast to the absence of any early signal of extreme rainfall in southeast Europe at ~6 day leads (Figure 4a), for events over Libya the potential for extreme medicane-related rainfall was already clearcut in ENS output seven days before. This is apparent in Figure 7a, which shows an IFS cyclonic feature forecast for T+168 h, from the operational cyclone database suite, in which the ‘maximum 12 h rainfall’ cyclone attribute is denoted by spot colour (see legend and caption). We can note many features over or near northern Libya; 21 of these (40% of members) have black spots at the centre, denoting a low centre and no clearcut fronts (the ‘barotropic low’ class). For these, the maximum 12 h rainfall lies between 50 and 200 mm. The higher predictability, relative to the southeast Europe events, is likely due to the predictability barrier related to Hurricane Franklin having already been crossed, and the necessary broadscale pattern over Europe (omega block + cut-off low) having been established.
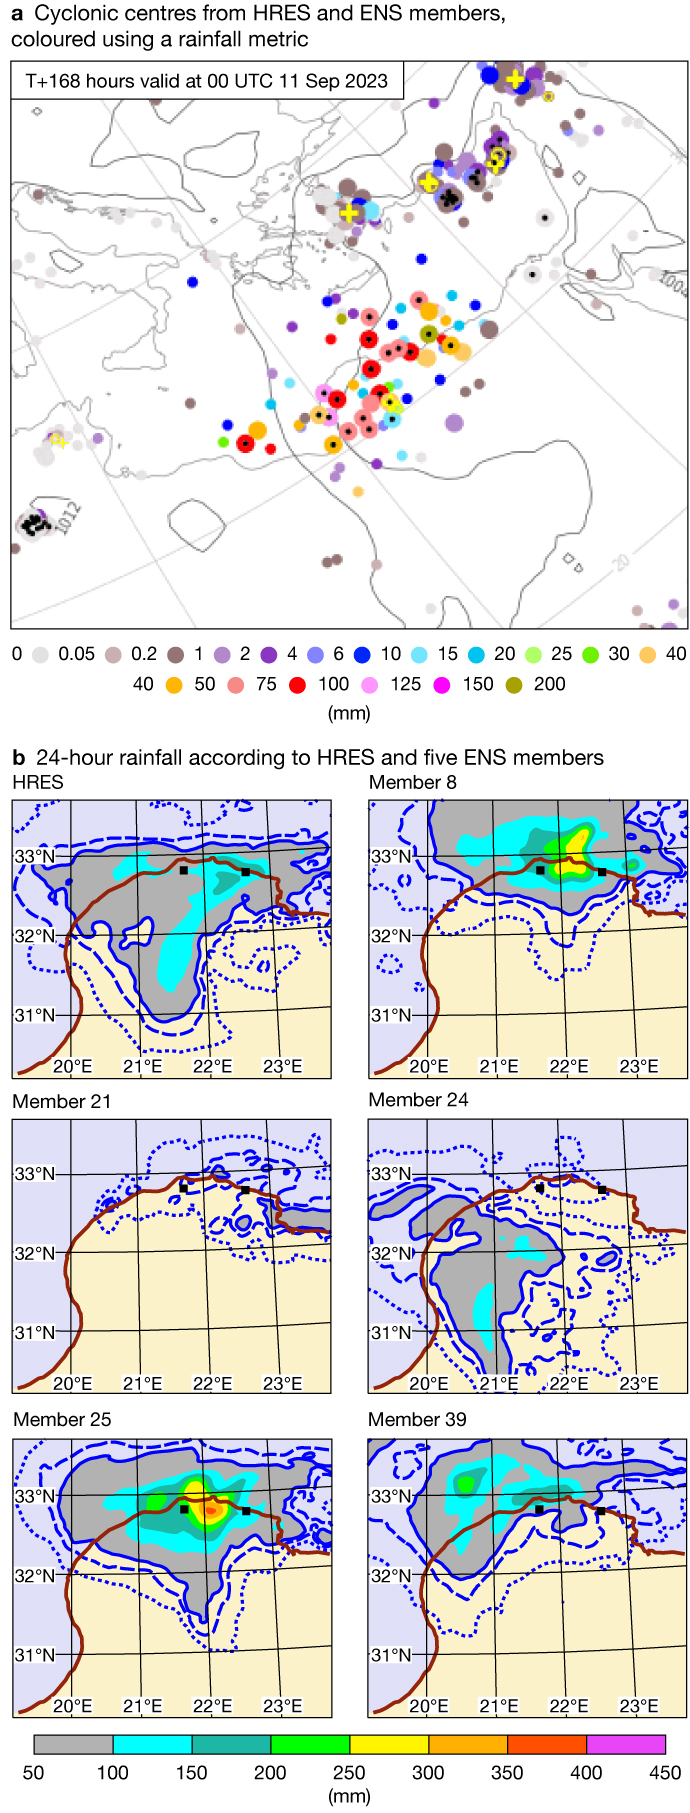
Figure 7b then shows examples of spatial 24 h rainfall forecasts from four days later, for a 24 h period, in HRES and various ensemble members. Verifying rainfall totals (the only ones officially available) are shown in Figure 10d. In these forecasts, whilst a cyclone track over Libya or very close by has become almost certain, rainfall amounts, and regional distribution, remain highly uncertain. Relative to the Wadi Derna catchment (Figure 1d), two of these members (8 and 25) have very extreme rainfall (say > 200 mm/24h); HRES is not as extreme, member 39 keeps rainfall mainly over the ocean, whilst members 21 and 24 do not show enough rainfall to even cause any streamflow in the ordinarily dry river valley. The local limit before runoff starts has been calculated to be about 30 mm when soil is initially dry. From a warning perspective, this situation would be challenging to manage – we have a huge range of possible outcomes, despite high confidence in the broadscale pattern.
As regards actual rainfall generation mechanisms, the representative sounding in Figure 5b exhibits similar characteristics to the Greek sounding in Figure 5a. There is deep instability to nearby SST triggering, again with skinny CAPE and parcels potentially reaching the tropopause. Moisture content low down is higher, 15 g/kg versus 12 g/kg in Figure 5a, whilst lower tropospheric winds are a bit stronger. These impinge on the coast from the north, and indeed onto north-facing escarpments (one is visible a little way inland in Figure 8). Thus winds would bring convection inland, convection which can also be augmented by ascent over the slopes. So whilst topography is not as high as it is near to Portaria, other ingredients favoured more rain. In addition, we have strong forcing related to the medicane deepening, and to the aforementioned upper-level structures. On the other hand, the cyclone is now mobile, while in Greece conditions were relatively static, prolonging the rainfall there.
Strong forcing would tend to mitigate against the erroneous focusing of coastal water convection that we saw in Figure 6; indeed the seemingly comparable member 39 pattern on Figure 7b was atypical.
Flood forecasting and dam collapse
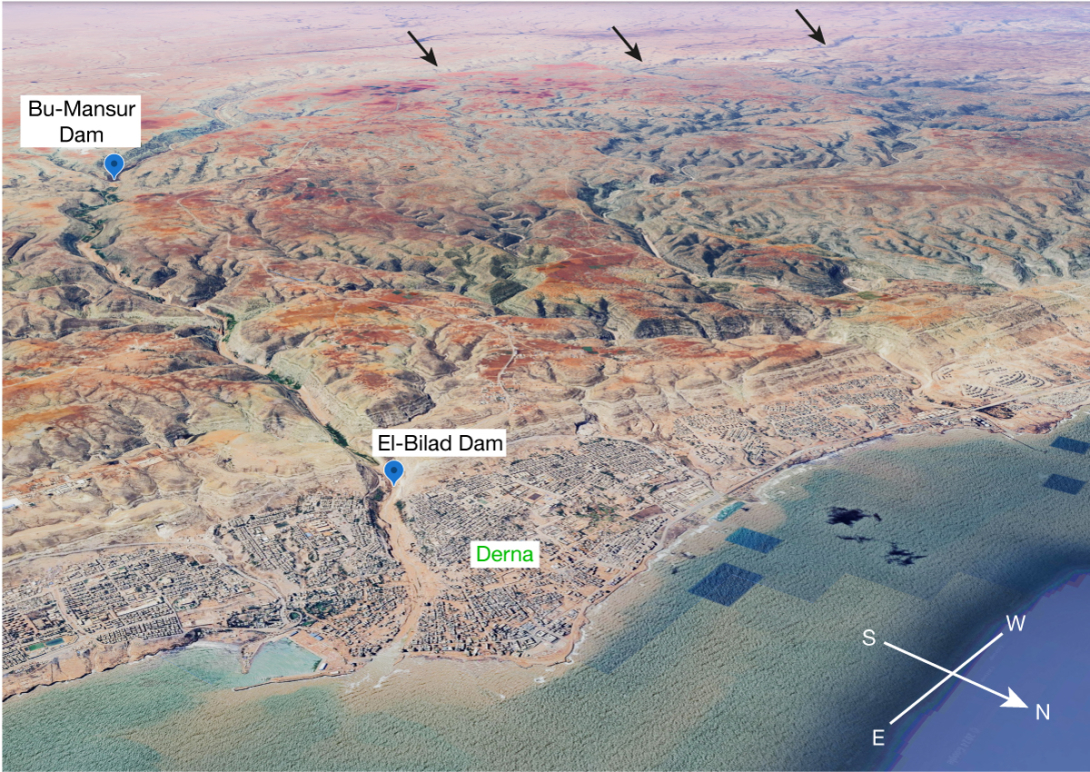
To set the scene for hydrological considerations, Figure 8 shows a 3D rendering of the topography of the Wadi Derna valley and catchment, and surrounding areas. Whilst Wadi Derna is ordinarily dry, one can nonetheless infer that the landscape has, over geological timescales, been shaped by major flooding events, and associated landslides, with many steep-sided valleys etched into the elevated terrain.
Prior to Daniel there were two dams, marked in Figure 8. The Bu Mansur dam had a capacity of 22.5 million m3, whilst El Bilad, downstream, had a capacity of 1.5 million m3. Clearly, then, any failure of the upper dam would overwhelm the lower dam. Note also that the full catchment is relatively small, spanning just 575 km2.
Under the auspices of the European Commission’s Copernicus Emergency Management Service (CEMS), managed by the Joint Research Centre (JRC), ECMWF runs the CEMS hydrological forecasting centre. As part of the CEMS remit, the Global Flood Awareness System (GloFAS) aims to alert users to the possibility of flooding anywhere in the world, based on hydrological modelling at ~5 km. Many layers are publicly available to display potential flood situations interactively with a web tool, with the predictions relying on ensemble rainfall forecasts from ECMWF (9 km resolution) as their primary input. Meanwhile, weather analyses from ERA5 (31 km resolution) are used in a retrospective mode as forcing for the GloFAS hydrological model, to create climatological reference points for river discharge, expressed as return periods.
We should add some important caveats regarding GloFAS usage for this case. Firstly, although GloFAS simulations include the impact of about 600 of the world’s largest reservoirs (and their dams), there is nothing of this type for the small catchment of Wadi Derna. Moreover, GloFAS certainly does not allow for dam collapse. In reality, the Wadi Derna valley was dry at the start of the event (i.e. no reservoir water), whilst spillways for each dam were kept fully open throughout. Secondly, whilst the scale mismatch between ERA5 (31 km) and ENS (9 km) resolutions is not that critical for large catchments, it can become problematic for small catchments, due to rainfall sub-grid variability and catchment rainfall representativeness issues. This is very relevant here because, in areal extent, Wadi Derna spans about 7 ENS grid boxes, but only 0.6 ERA5 grid boxes. In practice, this means that whilst the ENS-based forecast discharge values can be reasonable given the right rainfall, the ERA5-based return period referencing is sub‑optimal. The third and final point is that ERA5 quality over time, over Libya rather than for example central Europe, will also have been compromised by a dearth of conventional observations for assimilation.
Figure 9 shows a set of GloFAS predictions for northern Libya, along with a Derna-based hydrograph, all from the same data time of 00 UTC on 8 September (as for Figure 7b). Normally the valley is dry, denoted by zero discharge from 3–9 September. However, many ensemble members quickly ramp up the discharge well into the (nominal) > 20 year return period class (purple background) on 10 and 11 September. On the map, purple shading shows modelled river pixels where the probability of exceedance of a 20‑year return period discharge, during a 30‑day forecast window, is > 30% for at least one day (numbers give maximum probability at selected points). So, from this product alone (albeit with the small catchment caveats) we could infer a high risk of flooding, with about a 70% chance for a severe situation to develop, but still a 25–30% chance, say, of something much less severe. Nonetheless, the range of possible discharge levels (on the graph) is still immense.

To try to assess what the true total discharge was for this event (Libya has no gauged rivers), an offline analysis was undertaken, using the customary Soil Conservation Service approach (SCS method: NRCS, 2008). This gave a 31 h average discharge rate of 890 m3/s, based on an estimated catchment rainfall value of 200 mm. This discharge can be compared with GloFAS values in the Figure 9 graph (admittedly for 24 h periods). Whilst the SCS value is very high, it is still almost within the GloFAS forecast range (max = 743 m3/s). This comparison thus lends credence to the GloFAS discharge forecasts.
Total storm discharge was computed, via the SCS method, to be 69 million m3, which is more than three times the upper dam capacity. Thus, even allowing for spillway release, overtopping became very likely. Indeed, on-the-ground data has indicated that substantial overtopping of the Bu Mansur dam did occur, causing disintegration and collapse, with the resulting wave of water then overwhelming the much lower capacity El Bilad dam downstream, around 01 UTC on 11 September, and going on to cause catastrophic impacts in Derna itself. Another important factor may have been the short duration; rain in Derna commenced at about 17 UTC, implying that 200 mm accumulated there in under 13 h.
Separate calculations (Ashoor & Eladawy, 2024) suggest that the lower El Bilad dam could have coped with discharge from its own much smaller catchment, via spillway release, had the upper dam not collapsed. This reiterates the fact that dam collapse acts to dramatically and dangerously amplify the nominal peak discharge well beyond what would have been observed had no dams been built.
Just as important as creating predictions is the communication of warnings to those that would manage any mitigating action (Golding, 2022). Very sadly, the needed actions, such as evacuation, did not take place. This was for multiple reasons. Golding refers to communication chain inadequacies as the “valleys of death”, a term which has a particular poignancy here.
Evaluating event rarity
We now outline some ways to contextualise actual (extreme) events. One can examine:
- Rainfall observation records
- Synthesised rainfall (based on free-running model simulations)
- Past extreme rainfall events
- Gridscale rainfall in reanalyses
- Point-scale rainfall inferred from reanalyses
- Simulations of the future
Option 1 was not used here; in any case discontinuities in observation records make this challenging. Options 2 and 6 are discussed together in Box A, focussing on synthesised medicane-related rainfall, based on climate model runs. Whilst skilful simulations of the future become vital if risk is changing sufficiently fast to diminish the relevance of real-event analysis, Box A shows that multi-model uncertainty is still much greater than the change in the multi-model mean, and that, even within this framework, Daniel was very much an outlier. All this then suggests a need for more work, because in the end climate change could potentially produce large positive or negative changes in rainfall. Further work should also encompass medicanes that are driven, in part, by baroclinic forcing (like Daniel – see the upper-level feature U in Figure 3c).
A
Long-term medicane risk in Libya
To assess the rarity of Storm Daniel in Libya, one can also use climate model simulations coupled with precipitation downscaling. We downscaled 20 CMIP5-generation simulations to produce 3,045 medicanes for each model, for both the historical period 1986–2005 and the period 2081–2100 under representative concentration pathway (RCP) 8.5. A total of 121,800 synthetic medicanes resulted. For more information on the downscaling, see Romero & Emanuel (2017) and Feldmann et al. (2019); here we give a brief overview.
Beginning with daily climate model output, we apply principal component analysis (PCA) for each month of each year during the two periods. The PCs are calculated using the spatial-field correlation matrix, calculated from the daily gridded fields over the Mediterranean region, of potential intensity (a function of SST and vertical profiles of temperature and humidity: see example parcel curve in purple on Figure 5b); temperature and relative humidity at 600 hPa; and geopotential heights at 850 and 250 hPa (as wind surrogates via the geostrophic relation). We then perform a second PCA to account for the temporal structure of the data. For these temporal correlations, we consider all the moving 10-day periods within the month. Random draws plus slight perturbations of this final set of extracted PCs, once converted back into physical space, allow one to generate 10‑day sequences of spatiotemporally coherent fields compatible with the reanalysis or global climate model climate. These sequences behave as genuine analogues of truly simulated synoptic evolutions.
Finally, we apply a genesis potential index to the synthetic fields, finding local maxima. If the maximum values exceed a pre-defined threshold, we construct a candidate medicane track beginning at that maximum and using a beta-and-advection model based on the synoptic-scale winds. Finally, we run a deterministic intensity model along the tracks (CHIPS = Coupled Hurricane Intensity Prediction System), and if maximum wind speeds exceed 34 kts, we include it in the final set of synthetic medicanes.
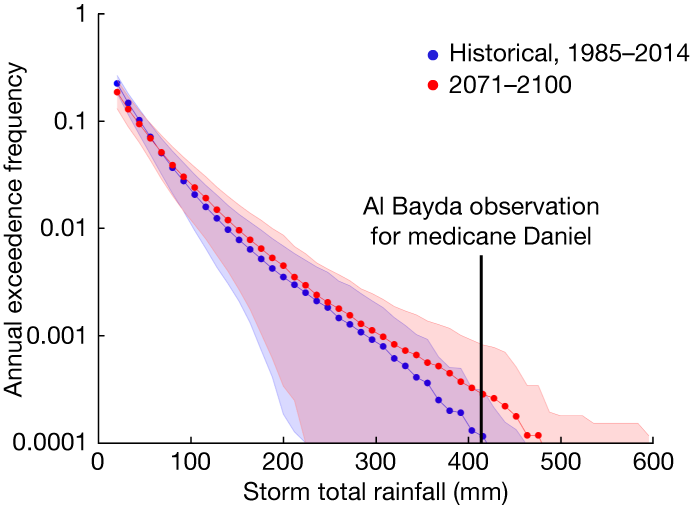
To estimate flooding potential in the region surrounding Derna, we used the synthetic medicanes to estimate long-term medicane-related rainfall exceedance frequencies for Al Bayda (where 414 mm was recorded). These are displayed above. The blue and red curves show the multi-model mean exceedance frequencies for the historical and future periods, respectively, and the shading represents one standard deviation among the 20 models. We see little if any significant difference between the historical and future periods, but large inter-model spread. Observing 400 mm from a pure medicane would be, by this calculation, an exceedingly rare event, with the most extreme model in the future climate having a return period over 500 years. Thus Daniel was either a freak event or affected by physics not included in our standard model of medicanes.
For option 3, we cross-reference an extreme flooding event in the Derna area in October 1959. Event rainfall values in mm are shown in Figure 10c (1/2 October), with Derna in red. In Derna itself 301 mm fell in 1959, versus 200 mm in 2023, although there was seemingly more spatial variability in 1959. Derna flooding in 1959 from the wadi peaked on the night of 2 September, and whilst there were considerable human and material losses, these were at a much lower level than in 2023. This was at least partly because there were then no dams, and (self-evidently) no dams collapsed. Figures 10a,b compare the synoptic situations for the 1959 and 2023 events using ERA5 data. The upper-level patterns (green) were strikingly similar, with a central Europe ridge/block, and an extended trough downstream reaching Libya. The surface pattern (red) is, however, very different, with no medicane in 1959. Whilst this could have been an early era reanalysis weakness, two other reanalyses do support the ERA5 picture, so maybe it is not. The absence of a medicane but presence of an upper trough, plus the time of year, suggest that deep, moist convective cells were responsible in 1959. At the same time, contour patterns imply high vertical (geostrophic) wind shear, which would have been conducive to convective organisation and longevity, whilst slack flow in the trough axis could also promote slow cell movement, and accordingly higher localised extremes. So, whilst the broadscale upper-level driver had a similar look in 1959, the surface weather picture was likely very different to 2023, with convective storms delivering extreme rainfall locally. For small catchments, this scenario can be more dangerous than widespread rainfall.
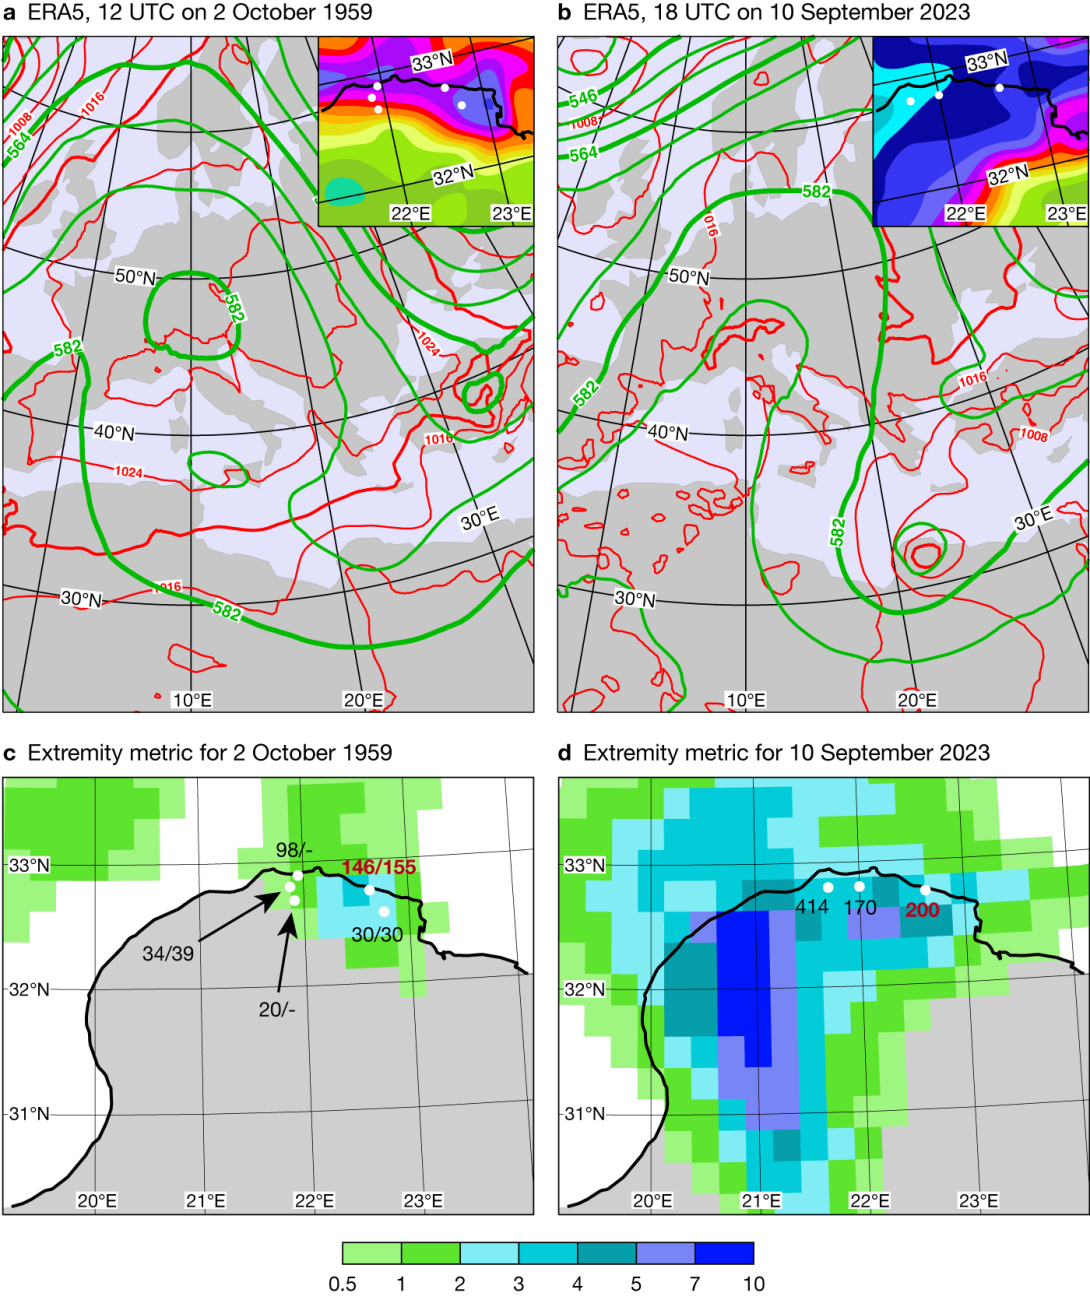
For option 4, we compare the grid-scale rainfall in ERA5 with a longer-term ERA5-based reference point, namely the median annual maximum over a (recent) 30‑year period. The ratio of the two is shaded in Figures 10c,d. In comparing in this way, without showing actual values, we tried to cancel out model-resolution-related issues (which are discussed, with examples, in Hewson, 2024). The truly widespread nature of the 2023 event is clear, but in the immediate vicinity of Derna (the two adjoining grid boxes, say) this ratio was much the same in 1959. Whilst such local details are not ordinarily that reliable, there is nonetheless a reasonable correlation between the ratios and observations we do have for the two cases. This assessment supports conclusions from option 3: much more localised rainfall in 1959, but possibly as extreme as in 2023 on the Wadi-Derna catchment scales.
For option 5, we use ERA5-ecPoint output, a downscaled version of ERA5 that aims to deliver a probabilistic representation of rainfall at point scale (akin to gauge measurements) within each ERA5 grid box (see Botazzi et al., 2024). Insets in Figure 10a,b show 99th percentiles for point rainfall so derived, for 2 October 1959 and 10 September 2023 respectively. Whilst values in the latter case are clearly higher, in both instances observed values seem to be in range. Indeed, in the 1959 case, whilst 155 mm in Derna would rank as very unlikely, it was still rated a plausible outcome from the synoptic pattern parameters encapsulated in the ecPoint post-processing (~1% probability or slightly less). Finally, Figure 11 provides, from 21 recent years of post-processed ERA5-ecPoint data, a 100‑year return period (RP) estimate for 24 h gauge-based rainfall. Whilst other datasets could admittedly give different RP estimates, an advantage of ecPoint is that it allows n-year RPs to be estimated from m years of data, where n>>m, without using extreme value theory/tail parametrization. At the three marked sites in Libya, which provided data for the Daniel case, the value is about 125 mm, suggesting that observed rainfall for Daniel, and the Derna value for the 1959 case (Figures 10c,d), were indeed very extreme (RP > 100 years), particularly at Al Bayda in 2023 (RP >> 100 years). Interestingly, the 100‑year return period value for Al Bayda is almost identical to the values given by climate model downscaling in the Figure in Box A. However, the presence of strong gradients across northern Libya in Figure 11 also suggests that intrinsic uncertainty in these values is locally elevated. On top of this, we know that topographically-enhanced convection can be associated with systematic model rainfall biases (Hewson & Pillosu, 2021). Such factors should be taken into account should any such data ever be used for design specification.

Finally, referring back to the European rainfall extremes discussed earlier (and reiterating that Figure 11 is not medicane-specific), we can also infer that, with this dataset, the referenced 24 h rainfall values recorded at Portaria, Strandja and Istanbul had RPs, respectively, of >> 100 years, ~100 years and << 100 years.
Summary
Key findings of this study are as follows:
- The Daniel cyclone/medicane lasted for eight days, meandering over the Mediterranean for six days before crossing northern Libya and then decaying over Egypt.
- The later track behaviour of Daniel was reassessed using multiple sources, including METAR observations and dust in imagery; the lowest central pressures (996 hPa) occurred over Libya.
- The strange intensification over land was attributed to forcing from anomalies at very high tropospheric levels. Earlier behaviour followed more conventional pathways.
- Model reruns suggest that release of heat from sand/soil over Libya did not aid deepening.
- Extreme rainfall/flooding over Bulgaria, Türkiye and Greece occurred whilst Daniel was developing as a discrete cyclone; flood devastation over Libya was much more directly related to Daniel’s passage.
- High moisture content, instability, high SSTs, topographic uplift and flow persistence all contributed to the rainfall/flooding events in Europe; in Libya, mechanisms were similar but persistence was less and dynamically forced uplift stronger.
- Medium-range forecasts for Europe were compromised by a predictability barrier related to upstream interactions between Hurricane Franklin and the mid-latitude waveguide. Later ensemble forecasts for Libya were able to raise alarms seven days in advance.
- ECMWF and DestinE runs at 9 km and 4.4 km resolution captured the European rainfall well at short leads; although both exhibited systematic and random errors, the DestinE 4.4 km runs were slightly better.
- Two-day lead-time discharge predictions for Wadi Derna from GloFAS exhibited extreme uncertainty, from a dry valley to extraordinarily high levels, reflecting different spatial rainfall patterns and the small catchment size.
- The actual (inferred) discharge was comparable with the wettest two‑day-lead GloFAS outcome.
- As runoff was about three times greater than dam capacity for Wadi Derna, dam collapse was almost inevitable; the resulting wave of water dramatically exacerbated impacts.
- Another devastating flooding event in October 1959 was also examined via reanalysis data – whilst the upper-level pattern and rainfall near Derna were similar to the 2023 case, rainfall was much more localised.
- Different ways of assessing event rarity for 24 h Libya rainfall gave relatively consistent answers; nominal event return periods were > 100 years in 1959 and >> 100 years in 2023.
Further reading
Ashoor, A. & A. Eladawy, 2024: Watch and Upgrade or Deconstruct and Relocate: Derna Catastrophe Lessons Amid the Climate-change Era of Unpredictable Flash Floods, PREPRINT (Version 1) available at Research Square. https://doi.org/10.21203/rs.3.rs-3858769/v1
Bister, M. & K.A. Emanuel, 2002: Low frequency variability of tropical cyclone potential intensity 1. Interannual to interdecadal variability. Journal of Geophysical Research: Atmospheres, 107. https://doi.org/10.1029/2001JD000776
Bottazzi, M., L. Rodríguez-Muñoz, B. Chiavarini, C. Caroli, G. Trotta, C. Dellacasa et al., 2024: High performance computing to support land, climate, and useroriented services: The HIGHLANDER Data Portal. Meteorological Applications, 31(2), e2166. https://doi.org/10.1002/met.2166
Cusack, E., L. Paterson, W.J. Lang & C. Csekits, 2017: WGCEF Task Team on Storm Naming in Europe. The European Forecaster. Vol. 22. P. 48-50. (euroforecaster.org/newsletter22/full.pdf)
Emanuel, K., 2018: 100 Years of Progress in Tropical Cyclone Research. Meteorological Monographs, 59. https://doi.org/10.1175/amsmonographs-d-18-0016.1
Feldmann, M., K. Emanuel, L. Zhu & U. Lohmann, 2019: Estimation of Atlantic tropical cyclone rainfall frequency in the United States. Journal of Applied Meteorology and Climatology, 58(8), 1853–1866. https://doi.org/10.1175/JAMC-D-19-0011.1
Golding, B. (ed.), 2022: Towards the “Perfect” weather warning: bridging disciplinary gaps through partnership and communication. Springer Cham. https://doi.org/10.1007/978-3-030-98989-7
Hewson, T.D., 2024: Capturing Extreme Rainfall events. ECMWF Newsletter 178, 2-3.
Hewson, T.D., & F.M. Pillosu, 2021: A low-cost postprocessing technique improves weather forecasts around the world. Communications Earth & Environment, 2, 132. https://doi.org/10.1038/s43247-021-00185-9
NRCS, 2008: National engineering handbook: Part 630— hydrology. USDA Soil Conservation Service: Washington, DC, USA.
Romero, R. & K. Emanuel, 2017: Climate Change and Hurricane-Like Extratropical Cyclones: Projections for North Atlantic Polar Lows and Medicanes Based on CMIP5 Models. Journal of Climate, 30(1), 279–299. https://doi.org/10.1175/JCLI-D-16-0255.1
Vannière, B., I. Sandu, P. Düben, M. Maier-Gerber, J. Schröttle & J. Denissen, 2024: A daily forecast with the prototype global Extremes Digital Twin of Destination Earth. ECMWF Newsletter No. 178, 10–11. https://doi.org/10.21957/1a8466ec2f
