Observations are essential for numerical weather prediction (NWP) systems. They are used by the data assimilation system to produce the best estimate of the initial conditions (analysis) for subsequent forecasts. The observing system has grown substantially in the past two decades and continues to evolve rapidly. At the time of writing, ECMWF receives over 700 million observation reports per day, of which approximately 40 million are used. The observations originate from approximately 100 data sources, ranging from individual satellites to in‑situ observation types.
Checking the health and usage status of the observing system is of interest to a wide range of users, from scientists working directly with observations to data providers and managers. ECMWF has developed a new operational observation dashboard providing near-real-time quick access to the status of the different components of the observing system (https://obsstatus.ecmwf.int/). The dashboard design offers a high-level view of the observing system for non-expert users, and a more detailed view for expert users.
Observation dashboard design and features
The observation dashboard is intended to serve the needs of a wide range of expert and non‑expert users thanks to featuring a cascading hierarchy of the observing system structure. It also uses a traffic light system to indicate the absence or presence of availability and quality anomalies detected by ECMWF’s automatic data checking system (https://www.ecmwf.int/en/newsletter/174/earth-system-science/use-machine-learning-detection-and-classification). The dashboard offers a link to the recently implemented on‑demand web monitoring system (https://www.ecmwf.int/en/newsletter/178/earth-system-science/demand-web-plotting-observation-monitoring-statistics). The design of the system enables the following features:
- The full observing system monitored by ECMWF is supported.
- New observations will automatically appear in the appropriate location within the observing system structure. Obsolete observations (no reports for more than 30 days) are automatically removed from the dashboard. This procedure enables the system to function with minimal maintenance.
- The status is updated twice a day to reflect the usage status and anomalies affecting the two main 4D‑Var analysis cycles. The status of ocean observations is updated once a day.
- The dashboard provides a history of the last few days to allow users to monitor the evolution of anomalies.
- Non-used observations are supported by the system. The associated icons are, however, greyed out to highlight the passive nature of these observations. Although passive observations are not supported by the automatic anomaly detection system, the dashboard will highlight cases when the data are temporarily not received by ECMWF.
- Users interested only in investigating data affected by anomalies have the option to hide channels not affected by warnings.
- For all components of the observing system, the dashboard offers direct links to time series from ECMWF’s on‑demand web monitoring system.
- For components of the observing system affected by anomalies, the dashboard provides a short description of the anomaly and a direct link to the time series produced by the automatic anomaly detection system.
The implementation of this dashboard will significantly improve the efficiency of monitoring activities, enhance the sharing of information with external users (including data providers), and improve the communication and reporting of aspects related to observations.
System architecture
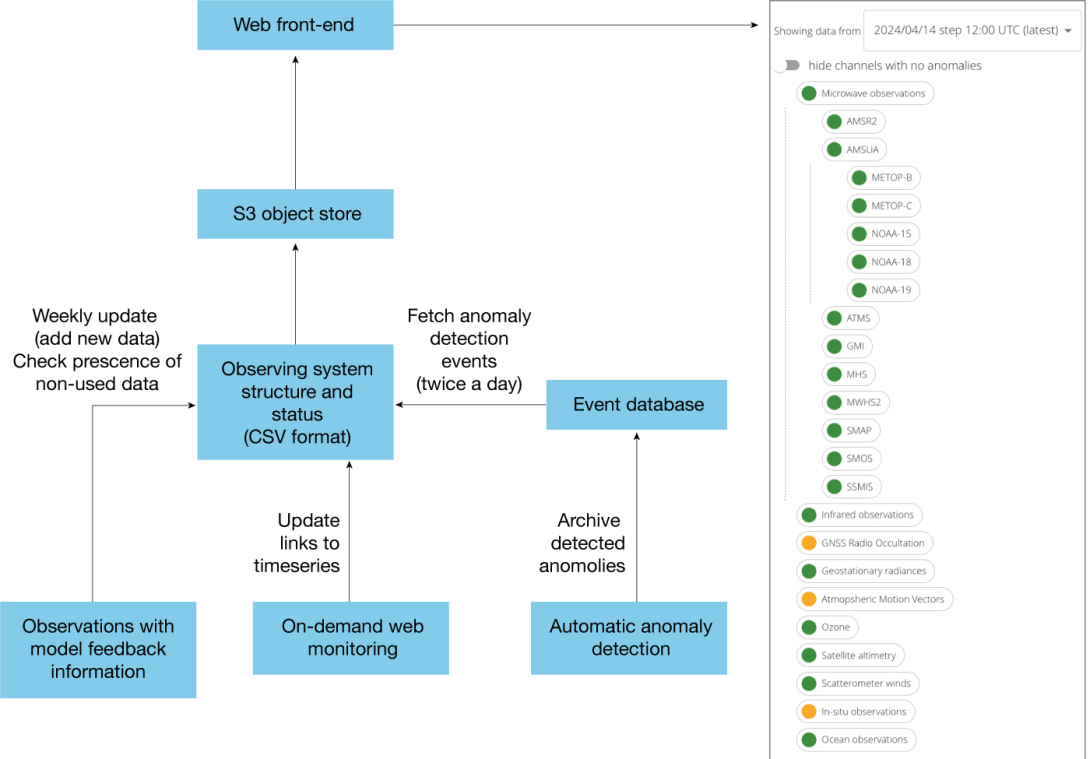
As a real-time status dashboard, the application needs to be highly available, with as few potential points of failure as possible. For this reason, we opted for a very lean architecture, with a minimum number of ‘moving parts’. The visible part of the dashboard is a front-end-only application, that runs in the browser and has no back-end component. This application gets the data from an object store, which is an Amazon Simple Storage Service (S3) bucket underpinned by a MinIO server hosted on the ECMWF data centre. Twice a day, when the suite runs, a script extracts the data from the Event database, formats it in a comma-separated values (CSV) file and sends the file to the object store. Having set up a specific retention policy, a built‑in feature of the MinIO object store, each file is removed after seven days. See the flow chart for an overview of the system’s architecture.

By simply using CSV files and leveraging an existing S3 object store with its built-in features, we have avoided the implementation of a separate backend and relative database. To some extent, we can say that the S3 object store fulfils at the same time the role of transient interchange data storage and that of a backend for the front-end application. Clearly, this architecture is minimalist and does not offer the potential to support more advanced features that would be easy to implement with a conventional backend/front-end architecture. However, it supports current requirements and reduces complexity and maintenance of the web stack (and therefore the likelihood of downtime) to an absolute minimum.
Expected evolution of the system
After its first operational implementation, the dashboard will undergo several enhancements that will enable an even better description of the observing system structure and related events. The planned upgrades include:
- adding support of observations used in atmospheric composition
- extending the support of satellite data from the global domain to other geographical regions
- extending the support of data to all geophysical quantities provided by each data type (currently an aggregated status is provided)
- fetching observation-related events from other sources (one candidate is the EUMETSAT user notification service)
- enhancing the traffic light system to allow a greater breakdown of data events
- adding more description and help texts within the dashboard.
Conclusion
The observations dashboard was initially intended to communicate detected observation anomalies. The project evolved towards a more inclusive and multi-purpose system that can serve the needs of a wide range of expert and non-expert users. The system as it is can be used as a first access point to explore ECMWF’s observation monitoring resources.
