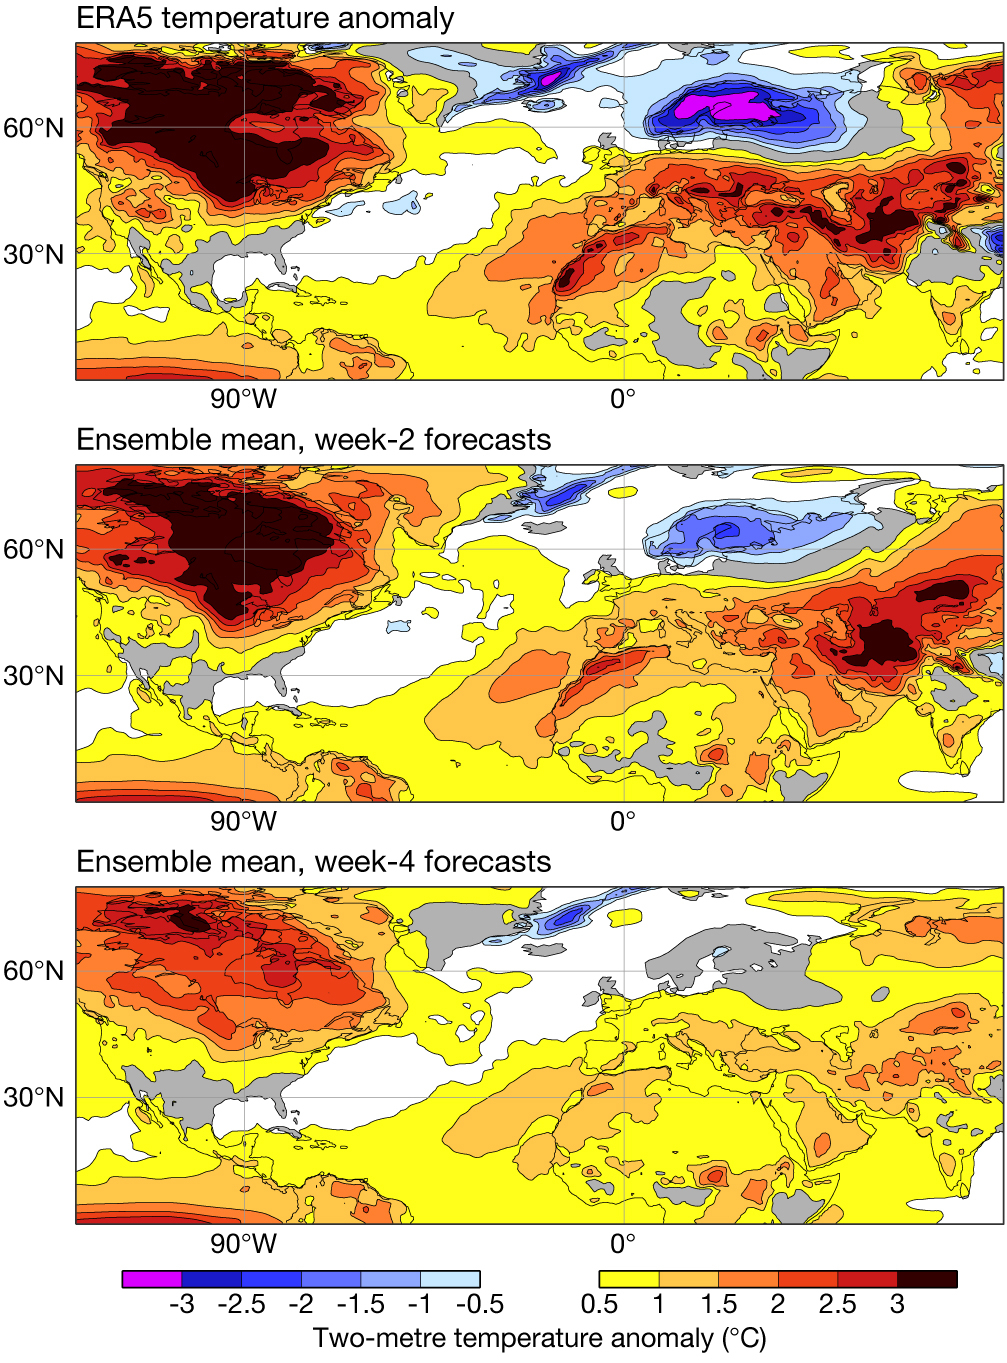
While the world as a whole experienced an unprecedentedly high average temperature in 2023, Northern Europe was one of the few areas that saw below-average temperatures compared to 1991–2020. Especially the autumn and the winter were dominated by cold anomalies, as seen in the composite of weekly anomalies in ECMWF’s ERA5 reanalysis from 2 October 2023 to 25 February 2024 (see the top panel in the first figure). For the evaluation in this article, we will focus on land points in a box covering most parts of Finland and the north-eastern corner of Sweden (see the box in the third figure, 60–67°N and 20–30°E).
Prediction of mean anomalies
The first figure shows composites of extended-range ensemble mean predictions of weekly mean 2‑metre temperature anomalies for weeks starting on 2 October to 18 February, based on Monday forecasts. The anomalies over Europe were well captured in week‑2 forecasts. A cold anomaly over Northern Europe was present on average in the week‑3 forecast (days 15–21), but with lower amplitude (not shown). A longer forecast (week‑4) had the warm signal present for continental Europe but was neutral for northern Europe. It still predicted that northern Europe would be colder than central Europe in terms of anomalies.

Predictions of week-to-week variability
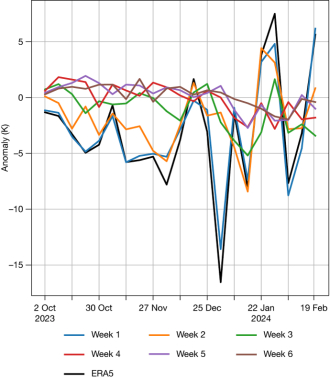
The second figure shows week-to-week variations of extended-range ensemble mean predictions and ERA5 analyses for the box over Finland/Sweden. Here we find negative anomalies in ERA5 for 17 out of 21 weeks (3 of the warm weeks appeared after mid-January). For the week‑4 forecasts over the region, most of the forecasts valid before New Year predicted a slight warm anomaly, and all forecasts afterwards predicted a cold anomaly. This resulted in a negative correlation with the outcome (–0.3). A similar signal is found for week 5 and 6 (not shown). Here we can note that the seasonal forecast from 1 October predicted a warm anomaly (above +1°) for November–February. The week‑3 forecasts mainly predicted cold anomalies in January, which could be related to a sudden stratospheric warming at the beginning of January. The week‑3 forecast gave a false alarm for cold weather in the week starting on 15 January. However, for the following week the week‑3 forecast captured the warm anomaly by persisting the signal from the week‑2 forecast. The overall correlation with the outcome for week‑3 forecasts was 0.22. The week‑2 forecast captured well the week-to-week variability (correlation of 0.65) except for the coldest week of the period, starting on 1 January, which had a weekly anomaly of –16° in the box in the ERA5 analysis.

Problematic forecast for beginning of January
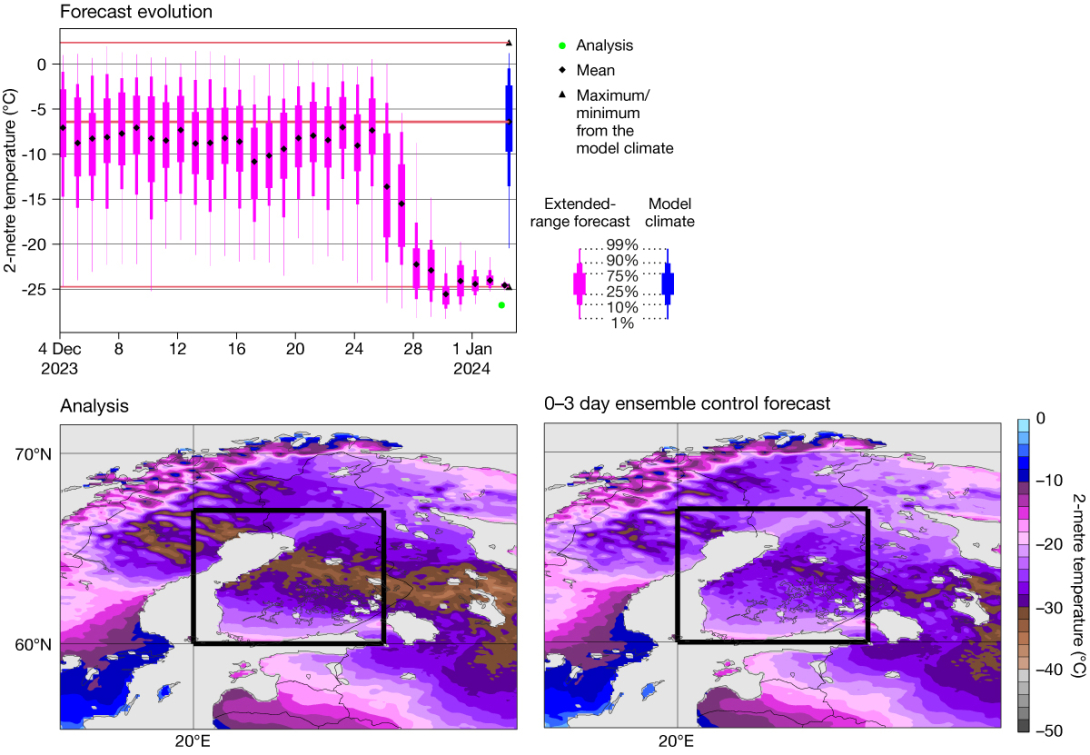
To understand the (lack of) skill for the first week of January further, we will focus on a 3‑day period (3–5 January). During these days, the coldest temperatures since 1999 were measured in both Sweden and Finland (–44.6°C and –44.3°C), and two stations in Sweden had a 3-day mean temperature below –40°C (2–4 January). According to the ECMWF analysis of 2‑metre temperature, large parts of central Finland had a 3-day mean temperature below –30°C (see the left-hand bottom panel of the last figure). Looking at the forecast evolution of 2-metre temperature inside the box (top panel of the last figure), based on the daily extended-range ensemble, the signal for the extreme cold appeared between 26 and 28 December (the same was found for the medium-range ensemble, not shown). The day‑6 forecast from 25 December as well as earlier forecasts included large errors over Europe. Predictability experiments using the nudging technique pointed to short-range errors on the downstream side of a trough over the central U.S. These affected the subsequent development of storm Geraldine, which hit France. Once the uncertainties in this development were overcome, medium-range predictions captured the extreme cold.

Prediction of local 2-metre temperature
Predicting very cold temperatures during calm conditions has been a long-standing challenge for ECMWF’s Integrated Forecasting System (IFS) as well as other models. It is believed that this issue is due to a combination of several model deficiencies that need to be tackled separately. In IFS Cycle 48r1 (implemented in June 2023), a multi-layer snow model was introduced that improved temperatures during clear conditions over snow. Looking at the spatial pattern of the 9 km control forecast averaged over the first 72 hours for 3 January 00 UTC (bottom right panel of the last figure), we see that the forecast underestimated the coldest extreme, such as the region where temperatures were below –30°C (brown shading). As reported in ECMWF Newsletter No. 178, in the upcoming Cycle 49r1 planned for late 2024, several changes are targeting 2‑metre temperature. Two‑metre temperature from SYNOP weather station observations will be used in the atmospheric data assimilation, while it is already used for the land data assimilation. This, together with changes related to the representation of the land surface and the interpolation to 2‑metre temperature, is expected to improve the 2‑metre temperature for the first forecast day(s).
Summary and outlook
In this article, we have discussed the prediction of cold temperatures in northern Europe during the winter 2023/24 on different timescales. During this period, the predictability of week-to-week anomalies did not reach much further than 2–3 weeks. This could be because the seasonal anomaly was due to a ‘driver of predictability’ that was not captured by the model, or because the cold season was a result of a series of synoptic events that led to a colder than normal season. In any event, more research is warranted on the interface between medium-range and sub-seasonal predictability.
