In February 2024, the Copernicus Climate Change Service (C3S), implemented by ECMWF on behalf of the European Commission, launched the Copernicus Interactive Climate Atlas (C3S Atlas in short). The C3S Atlas is a visualisation tool designed to provide complex climate information about the past (monitoring) and the future (projections) with only a few clicks. It is accessible at https://atlas.climate.copernicus.eu, and the first figure shows its landing page.

Background to the C3S Atlas
The most recent Assessment Report (AR6) of the Intergovernmental Panel on Climate Change (IPCC) provided a state-of-the-art review of climate change that also included, for the first time, an Interactive Atlas (IPCC-IA, https://interactive-atlas.ipcc.ch). This IPCC-IA is, however, a static application, ‘frozen’ to reflect the content of the AR6 report, with no updates planned before the IPCC’s seventh Assessment Report (AR7).
C3S embarked on a plan to operationalise the IPCC Atlas. This took into account C3S’s vision and priorities, but it was also aligned with IPCC requirements and principles. Particular attention was paid to the provision of regional climate information, the compatibility of data with the IPCC’s quality standards, and the enhancement of the functionality and interactive features of the graphical displays.
Robert Vautard, the co-chair of IPCC Working Group I (https://www.ipcc.ch/working-group/wg1/ – the Working Group which hosted IPCC-IA in AR6), said: “I really welcome the initiative of C3S to extend the life of the IPCC-IA, because it will continue to provide this information for decision-makers, students and scientists, and also for IPCC authors of the 7th assessment cycle.”
What is new in the C3S Atlas compared to the IPCC-IA?
The C3S Atlas visualises datasets which are available in the C3S Climate Data Store (CDS). The first version deployed includes gridded observations (E‑OBS); global reanalyses for the atmosphere, land, and ocean (ERA5, ERA5-Land and ORAS5, respectively); and climate projections (CMIP5, CMIP6 and CORDEX simulations). In particular, the CORDEX datasets include new information relative to the IPCC‑IA: CORDEX-CORE, with a horizontal resolution of 25 km for the land areas of the globe, forms a global mosaic from individual simulations available from the various CORDEX domains; and CORDEX‑EUR‑11 includes an even higher resolution for Europe (12.5 km). The simulations for Europe were partly financed by C3S.
In terms of functionalities, the most exciting new feature of the C3S Atlas viewer is the customised selection of regional domains. That includes domains pre‑defined in AR6, EUCRA (European Climate Risk Assessment) and European country regions, as well as any user-selected polygonal area of the globe.
What are the main visualisation features of the C3S Atlas?
The C3S Atlas displays global and regional information for 30 different climate variables and indices; for various climate scenarios; for different time periods and Global Warming Levels (GWLs); and for absolute values (climatology) and change values for monthly, seasonal and annual timescales.
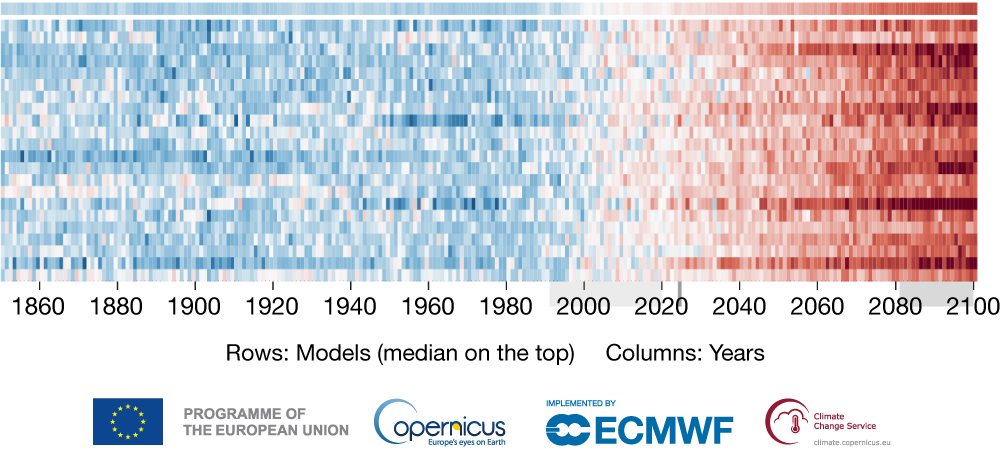
The main visualisation features include traditional global maps in different map projections; regional timeseries; various types of ‘climate stripes’ (including seasonal stripes); and annual cycle plots. A version of the climate stripes is shown in the second figure.

Most of the climate simulation plots display uncertainty information, visualised by combining the relevant projections from all available models. In global maps, this uncertainty is shown in terms of robustness (agreement or disagreement between the models) and various visualisations of model spread in regional timeseries and climate stripe plots.
Where can I find more information about the C3S Atlas?
C3S published a web article for the launch of the C3S Atlas: https://climate.copernicus.eu/copernicus-interactive-climate-atlas-game-changer-policymakers
